PROTECTED SOURCE SCRIPT
KVKZ
KVKZ = KV'S KILLZONES
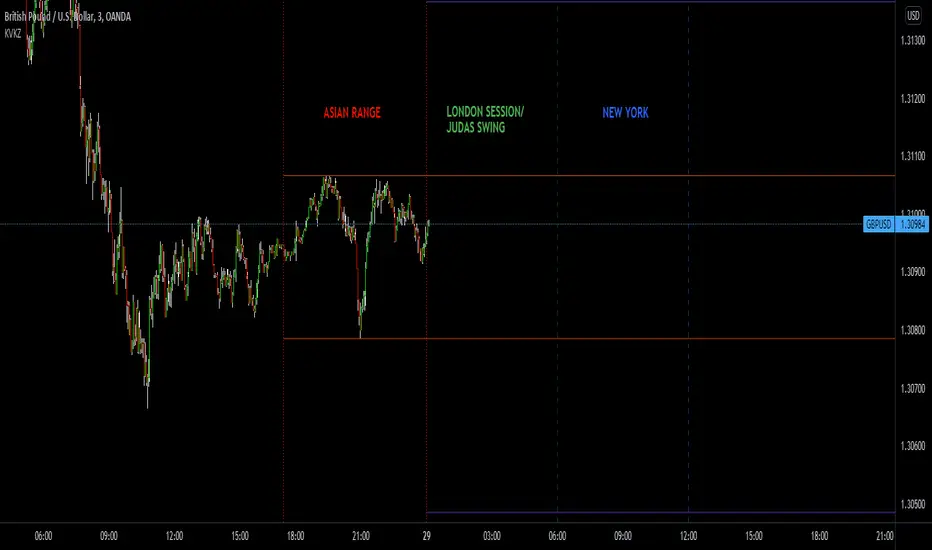
This Indicator, break the charts into session: ASIAN, LONDON, NEW YORK.
-The 1st two vertical lines (red) indicates the ASIAN RANGE
-The 2nd two vertical lines (red & green) indicates the LONDON session
-The 3rd two vertical lines (green & blue) indicates the NEW YORK session
-The will be no trading in between the two red vertical lines
-A fake move is expected to happen in between the 2nd red vertical line and green line, this fake move is known as the JUDAS SWING by ICT, you can YouTube Judas Swing and check out his concepts
-There are two automatically moving horizontal lines (orange), that plots the ASIAN high and lows, these levels are expected to be manipulated in the London session, and this is called the Judas Swing
-the purple lines are known as Institution Zones, basically just levels 30pips above and below the ASIAN range
-this indicator works well with GBPUSD, EURUSD, USDCHF
-this indicator doesn’t work well with USDJPY, AUDUSD, NZDUSD
INPUTS:
HOUR 1: 17
MIN 1 : 0
HOUR 2: 0
MIN 2 : 0
HOUR 3: 6
MIN 3 : 0
HOUR 4: 12
MIN 1 : 0
THIS INDICATOR IS NOT A HOLY GRAIL, BUT IF YOU CAN READ PRICE ACTION WELL, THESE SESSIONS BREAK DOWN COULD BE VERY USEFULL.
Extras:
dot = dotted lines
dsh = dashed lines
sol = solid lines
NOTE: time has to be set to NY time.
once you see what is possible, how can you do otherwise?
免責事項
これらの情報および投稿は、TradingViewが提供または保証する金融、投資、取引、またはその他の種類のアドバイスや推奨を意図したものではなく、またそのようなものでもありません。詳しくは利用規約をご覧ください。