OPEN-SOURCE SCRIPT
更新済 RSI Volatility Bands [QuantraSystems]

RSI Volatility Bands
Introduction
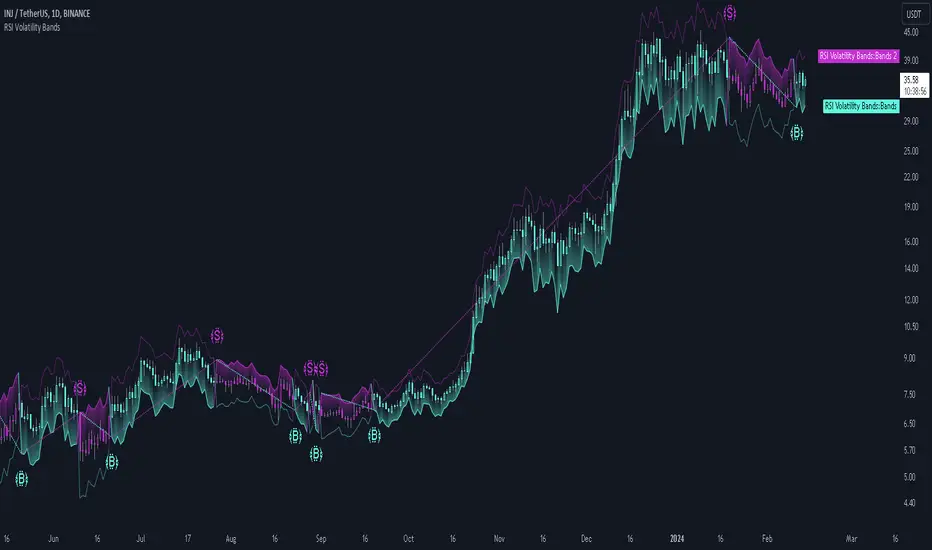
The RSI Volatility Bands indicator introduces a unique approach to market analysis by combining the traditional Relative Strength Index (RSI) with dynamic, volatility adjusted deviation bands. It is designed to provide a highly customizable method of trend analysis, enabling investors to analyze potential entry and exit points in a new and profound way.
The deviation bands are calculated and drawn in a manner which allows investors to view them as areas of dynamic support and resistance.

Legend

Case Study
Recommended Settings
The RSI Volatility Bands are highly customisable and can be adapted to many assets with diverse behaviors.
The calibrations used in the above screenshots are as follows:
Methodology
[list = 1]
*The indicator first calculates the RSI of the price data, and applies a custom moving average.
*The deviation bands are then calculated based upon the absolute difference between the RSI and its moving average - providing a unique volatility insight.
*The deviation bands are then adjusted with another smoothing function, providing clear visuals of the RSI’s trend within a volatility-adjusted context.
Pine Script®
By dynamically adjusting to market conditions, the RSI trend bands offer a unique perspective on market trends, and reversal zones.
Introduction
The RSI Volatility Bands indicator introduces a unique approach to market analysis by combining the traditional Relative Strength Index (RSI) with dynamic, volatility adjusted deviation bands. It is designed to provide a highly customizable method of trend analysis, enabling investors to analyze potential entry and exit points in a new and profound way.
The deviation bands are calculated and drawn in a manner which allows investors to view them as areas of dynamic support and resistance.
Legend
- Upper and Lower Bands - A dynamic plot of the volatility-adjusted range around the current price.
- Signals - Generated when the RSI volatility bands indicate a trend shift.
Case Study
- The chart highlights the occurrence of false signals, emphasizing the need for caution when the bands are contracted and market volatility is low.
- Juxtaposing this, during volatile market phases as shown, the indicator can effectively adapt to strong trends. This keeps an investor in a position even through a minor drawdown in order to exploit the entire price movement.
Recommended Settings
The RSI Volatility Bands are highly customisable and can be adapted to many assets with diverse behaviors.
The calibrations used in the above screenshots are as follows:
- Source = close
- RSI Length = 8
- RSI Smoothing MA = DEMA
- Bandwidth Type = DEMA
- Bandwidth Length = 24
- Bandwidth Smooth = 25
Methodology
[list = 1]
*The indicator first calculates the RSI of the price data, and applies a custom moving average.
*The deviation bands are then calculated based upon the absolute difference between the RSI and its moving average - providing a unique volatility insight.
*The deviation bands are then adjusted with another smoothing function, providing clear visuals of the RSI’s trend within a volatility-adjusted context.
rsiVal = ta.rsi(close, rsiLength)
rsiEma = ma(rsiMA, rsiVal, bandLength)
bandwidth = ma(bandMA, math.abs(rsiVal - rsiEma), bandLength)
upperBand = ma(bandMA, rsiEma + bandwidth, smooth)
lowerBand = ma(bandMA, rsiEma - bandwidth, smooth)
long = upperBand > 50 and not (lowerBand < lowerBand[1] and lowerBand < 50)
short= not (upperBand > 50 and not (lowerBand < lowerBand[1] and lowerBand < 50))
By dynamically adjusting to market conditions, the RSI trend bands offer a unique perspective on market trends, and reversal zones.
リリースノート
Fixed a bug when using the customized color palette.リリースノート
Added the option to hide the volatility band fill effect and the signals.リリースノート
Added 'Dynamic' capabilities.リリースノート
Updated Dynamic Function Library.Updated header name tag.
リリースノート
Updated License.License formatting shout out to RUBIX_BINARY
オープンソーススクリプト
TradingViewの精神に則り、このスクリプトの作者はコードをオープンソースとして公開してくれました。トレーダーが内容を確認・検証できるようにという配慮です。作者に拍手を送りましょう!無料で利用できますが、コードの再公開はハウスルールに従う必要があります。
No statements or claims aim to be financial advice,
neither are any signals from us or our indicators.
Join the Cryptosystems Community (formerly QuantraSystems)👇
discord.gg/FMZDM3bZ9T
neither are any signals from us or our indicators.
Join the Cryptosystems Community (formerly QuantraSystems)👇
discord.gg/FMZDM3bZ9T
免責事項
この情報および投稿は、TradingViewが提供または推奨する金融、投資、トレード、その他のアドバイスや推奨を意図するものではなく、それらを構成するものでもありません。詳細は利用規約をご覧ください。