OPEN-SOURCE SCRIPT
Long Short Momentum
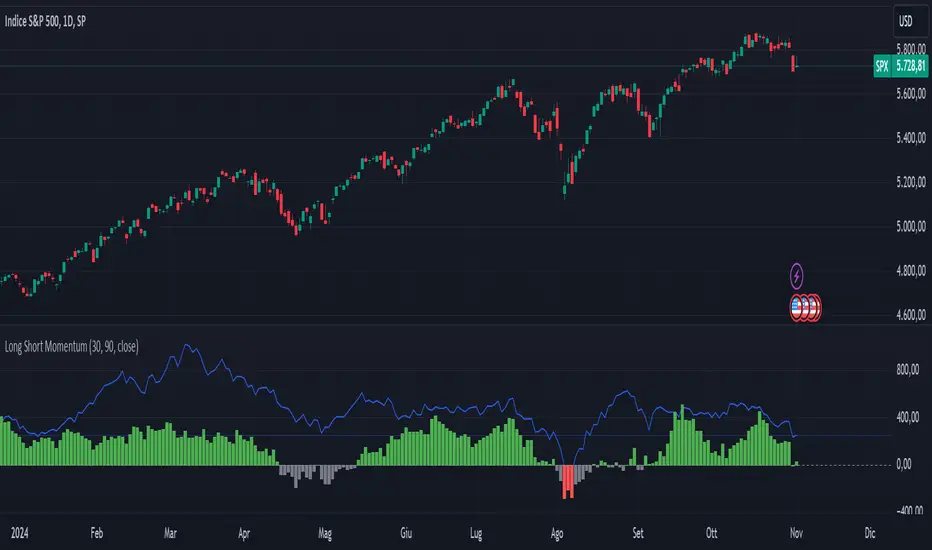
This indicator is designed to visualize short-term and long-term momentum trends.The indicator calculates two momentum lines based on customizable lengths: a short momentum (Short Momentum) over a smaller period and a long momentum (Long Momentum) over a longer period. These lines are plotted relative to the chosen price source, typically the closing price.
The histogram, colored dynamically based on momentum direction, gives visual cues:
The histogram, colored dynamically based on momentum direction, gives visual cues:
- Green: Both short and long momentum are positive, indicating an upward trend.
- Red: Both are negative, indicating a downward trend.
- Gray: Mixed momentum, suggesting potential trend indecision.
オープンソーススクリプト
TradingViewの精神に則り、このスクリプトの作者はコードをオープンソースとして公開してくれました。トレーダーが内容を確認・検証できるようにという配慮です。作者に拍手を送りましょう!無料で利用できますが、コードの再公開はハウスルールに従う必要があります。
免責事項
この情報および投稿は、TradingViewが提供または推奨する金融、投資、トレード、その他のアドバイスや推奨を意図するものではなく、それらを構成するものでもありません。詳細は利用規約をご覧ください。
オープンソーススクリプト
TradingViewの精神に則り、このスクリプトの作者はコードをオープンソースとして公開してくれました。トレーダーが内容を確認・検証できるようにという配慮です。作者に拍手を送りましょう!無料で利用できますが、コードの再公開はハウスルールに従う必要があります。
免責事項
この情報および投稿は、TradingViewが提供または推奨する金融、投資、トレード、その他のアドバイスや推奨を意図するものではなく、それらを構成するものでもありません。詳細は利用規約をご覧ください。