OPEN-SOURCE SCRIPT
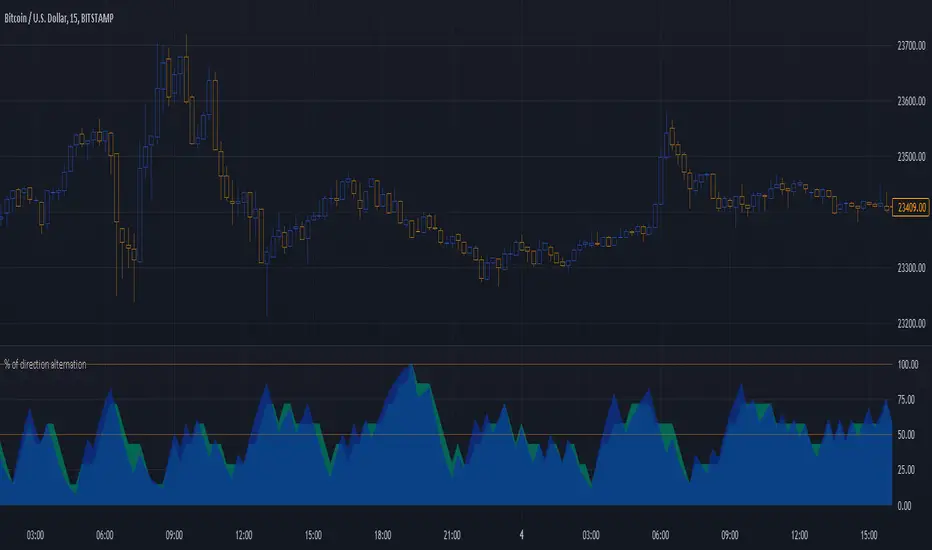
Percentage of direction alternation

This is just an idea I had and I have no idea whether it will be useful but I thought I would “toss it out into the wild” because if someone finds it of benefit then all the better.
How it works is really simple. It looks at a number of bars/candles back and if two bars next two each other close where one is higher than its open and the other closes lower (a bullish and bearish candle next to each other) then it adds one to the count of alternations. So, if you are looking 10 (adjustable of course) bars back then you can have 9 compares (number of bars subtract one).
If all nine compares are opposite closes of each other then you get a 100% alternation.
I’m not sure if this is useful for anyone but my original thought was the more alternation the more likely you are in ranging and the less you should consider entering a trade or the more you should consider exiting a trade. It might also reflect choppiness to some extent as well.
I also noticed in a couple of spots when I was looking at the results that good trends came just after the alternation peaked around 100% so it might be a bit of an indicator to enter a trade before the move happens.
It shows the alternation percentage but also the “weighted alternation” percentage which I think looks more useful as it give more credence to the alternations closer the live trading.
For visual usefulness you can invert the output so that maximum alternation is 0 instead of 100.
I’ve set it up as being displayed as area but as normal lines is also good.
Let me know if you find a way that it shows something useful for entering or exiting your trades. The more feedback I get the more I’ll throw my crazy notions out there!
The code is structured to easily drop into a bigger system so use it as a lone indicator or add the code to some bigger project you are creating. If you do integrate it into something else then send me a note as it would be nice to know it's being well used.
Enjoy and good luck!
オープンソーススクリプト
TradingViewの精神に則り、このスクリプトの作者はコードをオープンソースとして公開してくれました。トレーダーが内容を確認・検証できるようにという配慮です。作者に拍手を送りましょう!無料で利用できますが、コードの再公開はハウスルールに従う必要があります。
免責事項
この情報および投稿は、TradingViewが提供または推奨する金融、投資、トレード、その他のアドバイスや推奨を意図するものではなく、それらを構成するものでもありません。詳細は利用規約をご覧ください。
オープンソーススクリプト
TradingViewの精神に則り、このスクリプトの作者はコードをオープンソースとして公開してくれました。トレーダーが内容を確認・検証できるようにという配慮です。作者に拍手を送りましょう!無料で利用できますが、コードの再公開はハウスルールに従う必要があります。
免責事項
この情報および投稿は、TradingViewが提供または推奨する金融、投資、トレード、その他のアドバイスや推奨を意図するものではなく、それらを構成するものでもありません。詳細は利用規約をご覧ください。