OPEN-SOURCE SCRIPT
Pre Market High/Low Levels
Pre Market High & Pre Market Low By Jadra
Pre Market High/Low Levels Indicator
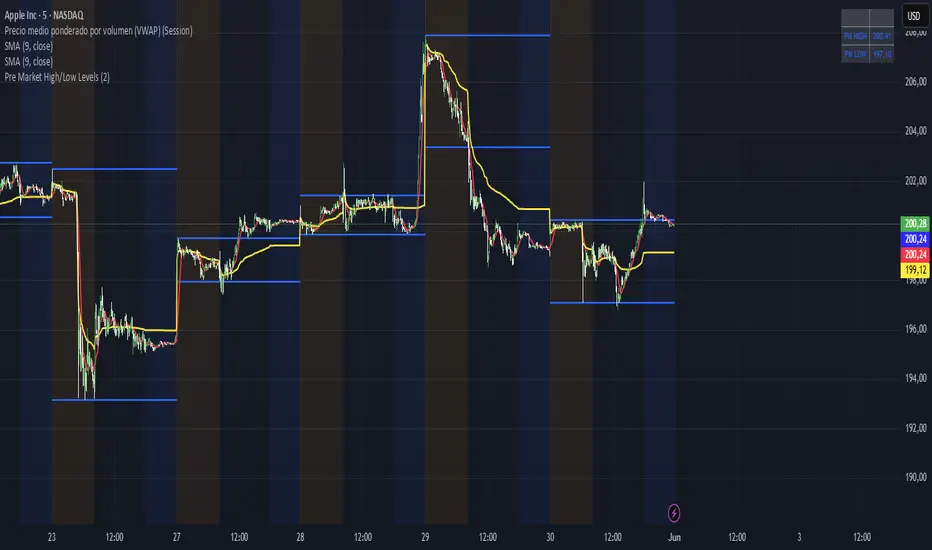
This indicator automatically identifies pre-market high and low levels (4:00-9:30 AM ET) and marks them with blue horizontal lines that extend throughout the entire trading session. Perfect for NYSE and NASDAQ traders who use these key levels as support and resistance. Features color-coded backgrounds: yellow for pre-market, transparent for regular hours, and blue for post-market. Lines remain visible from pre-market through market close, providing constant visual references for making trading decisions based on these important psychological levels. Essential tool for day traders focusing on overnight price action and gap analysis in US equity markets.
Pre Market High/Low Levels Indicator
This indicator automatically identifies pre-market high and low levels (4:00-9:30 AM ET) and marks them with blue horizontal lines that extend throughout the entire trading session. Perfect for NYSE and NASDAQ traders who use these key levels as support and resistance. Features color-coded backgrounds: yellow for pre-market, transparent for regular hours, and blue for post-market. Lines remain visible from pre-market through market close, providing constant visual references for making trading decisions based on these important psychological levels. Essential tool for day traders focusing on overnight price action and gap analysis in US equity markets.
オープンソーススクリプト
TradingViewの精神に則り、このスクリプトの作者はコードをオープンソースとして公開してくれました。トレーダーが内容を確認・検証できるようにという配慮です。作者に拍手を送りましょう!無料で利用できますが、コードの再公開はハウスルールに従う必要があります。
免責事項
この情報および投稿は、TradingViewが提供または推奨する金融、投資、トレード、その他のアドバイスや推奨を意図するものではなく、それらを構成するものでもありません。詳細は利用規約をご覧ください。
オープンソーススクリプト
TradingViewの精神に則り、このスクリプトの作者はコードをオープンソースとして公開してくれました。トレーダーが内容を確認・検証できるようにという配慮です。作者に拍手を送りましょう!無料で利用できますが、コードの再公開はハウスルールに従う必要があります。
免責事項
この情報および投稿は、TradingViewが提供または推奨する金融、投資、トレード、その他のアドバイスや推奨を意図するものではなく、それらを構成するものでもありません。詳細は利用規約をご覧ください。