OPEN-SOURCE SCRIPT
PhantomFlow AccumulationDetector
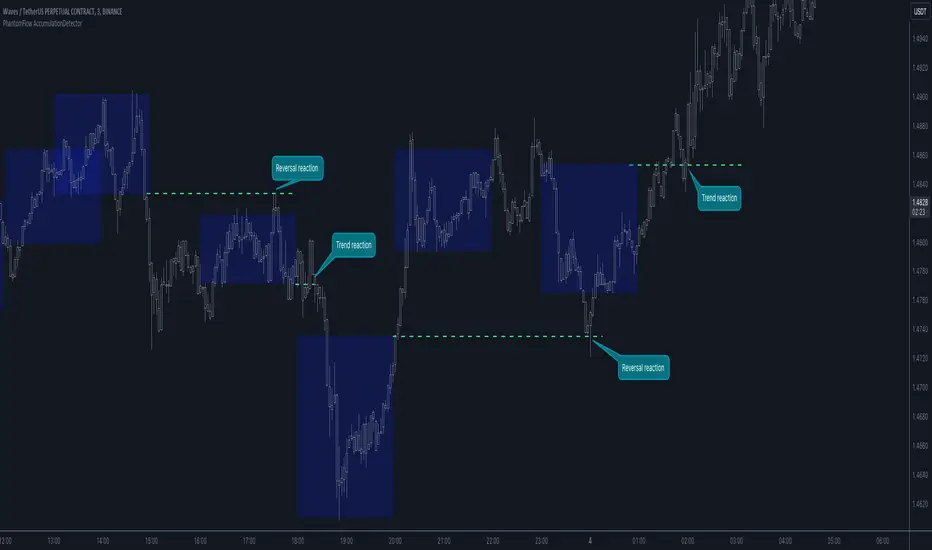
The PhantomFlow AccumulationDetector indicator analyzes the volume profile and displays potential accumulation based on the selected timeframe in the settings. This indicator can be used both as zones for trend following and for identifying reversals, as shown in the examples on the chart. The logic behind the formation of the accumulation zone is based on the fact that the POC (Point of Control) of the current zone is within the Volume Area range of the previous period.
Optimal settings for the working timeframe should be chosen visually, and the size of the zones should not be too large or too small. Additionally, it's advisable not to consider overly wide zones during increased volatility.
Consecutive zones within the same range often indicate a potential reversal.
We borrowed the volume profile calculation code from @LonesomeTheBlue. Thank you for the work done!
オープンソーススクリプト
TradingViewの精神に則り、このスクリプトの作者はコードをオープンソースとして公開してくれました。トレーダーが内容を確認・検証できるようにという配慮です。作者に拍手を送りましょう!無料で利用できますが、コードの再公開はハウスルールに従う必要があります。
免責事項
この情報および投稿は、TradingViewが提供または推奨する金融、投資、トレード、その他のアドバイスや推奨を意図するものではなく、それらを構成するものでもありません。詳細は利用規約をご覧ください。
オープンソーススクリプト
TradingViewの精神に則り、このスクリプトの作者はコードをオープンソースとして公開してくれました。トレーダーが内容を確認・検証できるようにという配慮です。作者に拍手を送りましょう!無料で利用できますが、コードの再公開はハウスルールに従う必要があります。
免責事項
この情報および投稿は、TradingViewが提供または推奨する金融、投資、トレード、その他のアドバイスや推奨を意図するものではなく、それらを構成するものでもありません。詳細は利用規約をご覧ください。