OPEN-SOURCE SCRIPT
M.Kiriti RSI with SMA & WMA
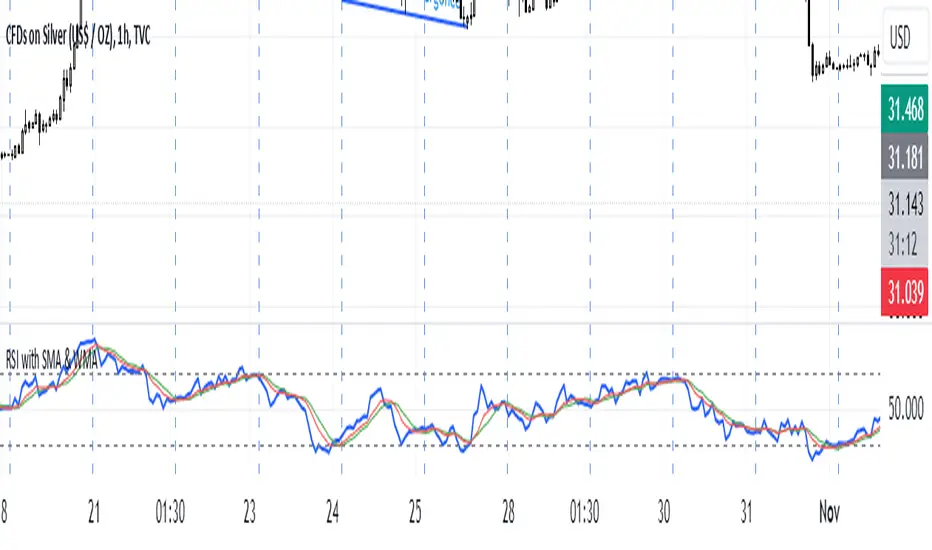
This script is a custom RSI indicator with added SMA and WMA moving averages to smooth RSI trends and improve analysis of momentum shifts.
1. RSI Calculation: Measures 14-period RSI of the closing price, default threshold levels at 70 (overbought) and 30 (oversold).
2. Moving Averages (SMA and WMA):
- SMA and WMA are applied to RSI for trend smoothing.
- SMA gives equal weight; WMA gives more weight to recent values, making it more responsive.
3.Overbought/Oversold Lines and Labels:
- Horizontal lines and scale labels at 70 (overbought) and 30 (oversold) make these levels easy to reference.
This indicator is useful for identifying potential reversal points and momentum trends when RSI crosses its moving averages.
オープンソーススクリプト
TradingViewの精神に則り、このスクリプトの作者はコードをオープンソースとして公開してくれました。トレーダーが内容を確認・検証できるようにという配慮です。作者に拍手を送りましょう!無料で利用できますが、コードの再公開はハウスルールに従う必要があります。
免責事項
この情報および投稿は、TradingViewが提供または推奨する金融、投資、トレード、その他のアドバイスや推奨を意図するものではなく、それらを構成するものでもありません。詳細は利用規約をご覧ください。
オープンソーススクリプト
TradingViewの精神に則り、このスクリプトの作者はコードをオープンソースとして公開してくれました。トレーダーが内容を確認・検証できるようにという配慮です。作者に拍手を送りましょう!無料で利用できますが、コードの再公開はハウスルールに従う必要があります。
免責事項
この情報および投稿は、TradingViewが提供または推奨する金融、投資、トレード、その他のアドバイスや推奨を意図するものではなく、それらを構成するものでもありません。詳細は利用規約をご覧ください。