OPEN-SOURCE SCRIPT
STY-Divergence
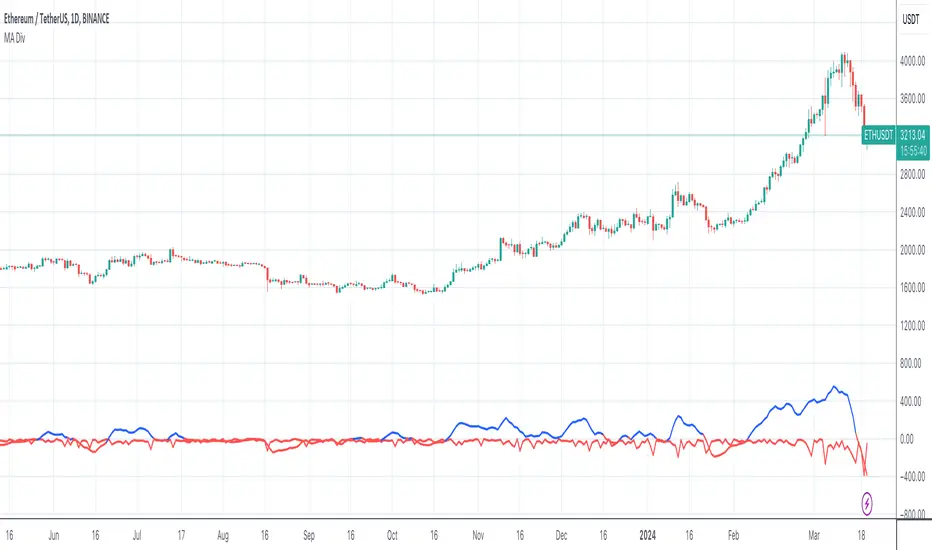
draws a blue line representing the divergence between a 3-period moving average (3MA) close and the current candle high, and a red line representing the divergence between a 20-period moving average (20MA) close and the 3MA close
This script calculates the moving averages for both 3-period and 20-period and then computes the divergences as described. It plots the lines with blue color if the divergence is positive and red if negative. Adjust the length of moving averages or other parameters according to your preference.
This script calculates the moving averages for both 3-period and 20-period and then computes the divergences as described. It plots the lines with blue color if the divergence is positive and red if negative. Adjust the length of moving averages or other parameters according to your preference.
オープンソーススクリプト
TradingViewの精神に則り、このスクリプトの作者はコードをオープンソースとして公開してくれました。トレーダーが内容を確認・検証できるようにという配慮です。作者に拍手を送りましょう!無料で利用できますが、コードの再公開はハウスルールに従う必要があります。
免責事項
この情報および投稿は、TradingViewが提供または推奨する金融、投資、トレード、その他のアドバイスや推奨を意図するものではなく、それらを構成するものでもありません。詳細は利用規約をご覧ください。
オープンソーススクリプト
TradingViewの精神に則り、このスクリプトの作者はコードをオープンソースとして公開してくれました。トレーダーが内容を確認・検証できるようにという配慮です。作者に拍手を送りましょう!無料で利用できますが、コードの再公開はハウスルールに従う必要があります。
免責事項
この情報および投稿は、TradingViewが提供または推奨する金融、投資、トレード、その他のアドバイスや推奨を意図するものではなく、それらを構成するものでもありません。詳細は利用規約をご覧ください。