INVITE-ONLY SCRIPT
更新済 Relative Trend Navigator Pro [QuantAlgo]
Upgrade your trend-following investing and trading strategy with Relative Trend Navigator Pro by QuantAlgo, a sophisticated technical indicator that combines adaptive trend recognition with dynamic momentum analysis to deliver high quality market insights. Whether you're a medium- to long-term investor focusing on sustained moves or an active trader seeking high-probability entries, this indicator's multi-layered approach offers valuable strategic advantages that you don't want to miss out on!
🟢 Core Architecture
The foundation of this indicator lies in its innovative Relative Trend Index (RTI) calculation and dynamic state management system. By implementing a unique array-based analysis alongside statistical volatility measures, each price movement is evaluated against its historical context while maintaining responsiveness to current market conditions. This sophisticated approach helps distinguish genuine trend developments from market noise across various timeframes and instruments.

🟢 Technical Foundation
Three key components power this indicator are:

🟢 Key Features & Signals
The Relative Trend Navigator Pro delivers market insights through:

🟢 Practical Usage Tips
Here's how to maximize your use of the Relative Trend Navigator Pro:
1/ Setup:
2/ Reading Signals:
🟢 Pro Tips
🟢 Core Architecture
The foundation of this indicator lies in its innovative Relative Trend Index (RTI) calculation and dynamic state management system. By implementing a unique array-based analysis alongside statistical volatility measures, each price movement is evaluated against its historical context while maintaining responsiveness to current market conditions. This sophisticated approach helps distinguish genuine trend developments from market noise across various timeframes and instruments.
🟢 Technical Foundation
Three key components power this indicator are:
- Dynamic Trend Boundaries: Utilizes standard deviation-based channels to establish adaptive price ranges
- Array-Based Historical Analysis: A comprehensive dynamic momentum system that processes and sorts historical data for trend context
- Relative Trend Index (RTI): A normalized calculation that measures current price position relative to historical boundaries
🟢 Key Features & Signals
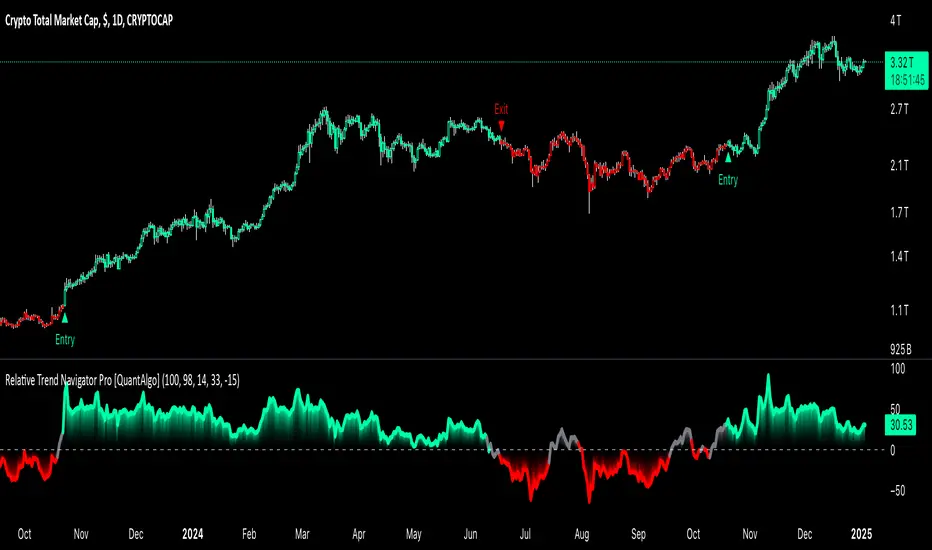
The Relative Trend Navigator Pro delivers market insights through:
- Color-adaptive RTI line that reflects trend strength and direction
- Dynamic threshold levels for bull and bear signal generation
- Smart fill coloring between RTI and zero line for enhanced visualization
- Clear entry and exit markers for validated trend changes
- Intelligent bar coloring that highlights current trend state
- Customizable alert system for both bullish and bearish setups
🟢 Practical Usage Tips
Here's how to maximize your use of the Relative Trend Navigator Pro:
1/ Setup:
- Add the indicator to your favorites ⭐️
- Begin with the default historical lookback for balanced analysis
- Use the default sensitivity setting for optimal signal generation
- Start with standard threshold levels
- Customize visualization colors to match your chart preferences
- Enable both bar coloring and signal markers for complete visual feedback
2/ Reading Signals:
- Watch for signal markers - they indicate validated trend transitions
- Monitor RTI line color changes for trend direction confirmation
- Observe the fill color between RTI and zero line for trend strength
- Use the built-in alert system to stay informed of potential trend changes
🟢 Pro Tips
- Adjust Historical Lookback Period based on your preferred timeframe:
→ Lower values (20-50) for more responsive signals
→ Higher values (100-200) for more stable trend identification
- Fine-tune Sensitivity based on market conditions:
→ Higher values (95-100) for choppy markets
→ Lower values (85-95) for trending markets
- Optimize Threshold Levels for your strategy:
→ Increase thresholds for stronger trend confirmation
→ Decrease thresholds for earlier entries
- Combine with:
→ Volume analysis for trade confirmation
→ Multiple timeframe analysis for strategic context
→ Support/resistance levels for entry/exit refinement
リリースノート
Updated alerts.リリースノート
Updated alerts.招待専用スクリプト
このスクリプトは作者が承認したユーザーのみアクセス可能です。使用するにはアクセス申請をして許可を得る必要があります。通常は支払い後に承認されます。詳細は下記の作者の指示に従うか、QuantAlgoに直接お問い合わせください。
TradingViewは、作者を完全に信頼し、スクリプトの動作を理解していない限り、有料スクリプトの購入・使用を推奨しません。コミュニティスクリプトには無料のオープンソースの代替が多数あります。
作者の指示
Available as part of our Premium package (3-day FREE trial) here: https://whop.com/quantalgo/
👉 Access our best trading & investing tools here (3-day FREE trial): whop.com/quantalgo/
免責事項
この情報および投稿は、TradingViewが提供または推奨する金融、投資、トレード、その他のアドバイスや推奨を意図するものではなく、それらを構成するものでもありません。詳細は利用規約をご覧ください。
招待専用スクリプト
このスクリプトは作者が承認したユーザーのみアクセス可能です。使用するにはアクセス申請をして許可を得る必要があります。通常は支払い後に承認されます。詳細は下記の作者の指示に従うか、QuantAlgoに直接お問い合わせください。
TradingViewは、作者を完全に信頼し、スクリプトの動作を理解していない限り、有料スクリプトの購入・使用を推奨しません。コミュニティスクリプトには無料のオープンソースの代替が多数あります。
作者の指示
Available as part of our Premium package (3-day FREE trial) here: https://whop.com/quantalgo/
👉 Access our best trading & investing tools here (3-day FREE trial): whop.com/quantalgo/
免責事項
この情報および投稿は、TradingViewが提供または推奨する金融、投資、トレード、その他のアドバイスや推奨を意図するものではなく、それらを構成するものでもありません。詳細は利用規約をご覧ください。