OPEN-SOURCE SCRIPT
更新済 Niteya BG Candle Formations

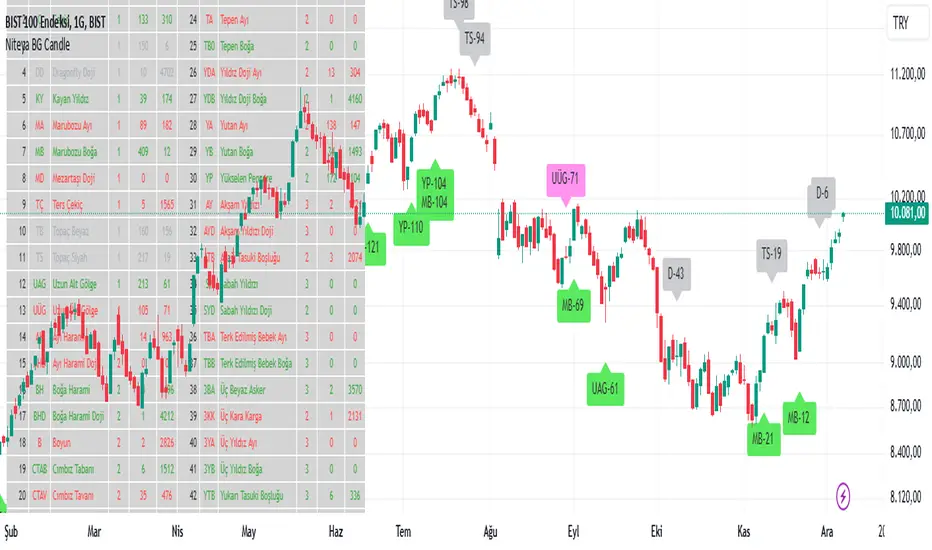
Niteya BG Candle Formations is an indicator that shows the total number of formations of each of the 44 different candlestick formations and the index of the last bar it was formed in a table and on a chart.
It shows candlestick formations that express uptrends and downtrends and indecisive market conditions in different colors.
The table columns contain the values shown below:
S.No: Candlestick formation bar index number
Code: Candlestick formation abbreviation
Formation: Name of the candlestick formation
Quantity: Number of candles in the formation
Total: Total number of formations on the chart
Last: Index of the last formation on the chart
bilgigunlugum.net/public/images/borsa/candlef_1.png
Details
bilgigunlugum.net/borsa/pine_script/pine_script_indicator/candlef
Türkçe açıklaması
Niteya BG Candle Formations, toplam 44 adet farklı mum formasyonunun her birinin toplam oluşma sayısını ve en son oluştuğu barın endeksini bir tabloda ve grafik üzerinde gösteren bir indikatördür.
Yükseliş ve düşüş trendleri ile kararsız piyasa durumlarını ifade eden mum formasyonlarını farklı renkte gösterir.
Tablo sütunları aşağıda gösterilen değerleri içerir:
S.No: Mum formasyonu sıra numarası
Kod: Mum formasyonu kısaltması
Formasyonu: Mum formasyonunun adı
Adet: Formasyonu oluşturan mum sayısı
Toplam: Grafikte gerçekleşen toplam formasyon sayısı
Son: Grafikte gerçekleşen en son formasyon endeksi
bilgigunlugum.net/public/images/borsa/candlef_1.png
Detaylar
bilgigunlugum.net/borsa/pine_script/pine_script_indicator/candlef
リリースノート
Table and character sizes have been reduced.オープンソーススクリプト
TradingViewの精神に則り、このスクリプトの作者はコードをオープンソースとして公開してくれました。トレーダーが内容を確認・検証できるようにという配慮です。作者に拍手を送りましょう!無料で利用できますが、コードの再公開はハウスルールに従う必要があります。
免責事項
この情報および投稿は、TradingViewが提供または推奨する金融、投資、トレード、その他のアドバイスや推奨を意図するものではなく、それらを構成するものでもありません。詳細は利用規約をご覧ください。
オープンソーススクリプト
TradingViewの精神に則り、このスクリプトの作者はコードをオープンソースとして公開してくれました。トレーダーが内容を確認・検証できるようにという配慮です。作者に拍手を送りましょう!無料で利用できますが、コードの再公開はハウスルールに従う必要があります。
免責事項
この情報および投稿は、TradingViewが提供または推奨する金融、投資、トレード、その他のアドバイスや推奨を意図するものではなく、それらを構成するものでもありません。詳細は利用規約をご覧ください。