OPEN-SOURCE SCRIPT
Volume HeatMap Divergence [BigBeluga]

🔵 OVERVIEW
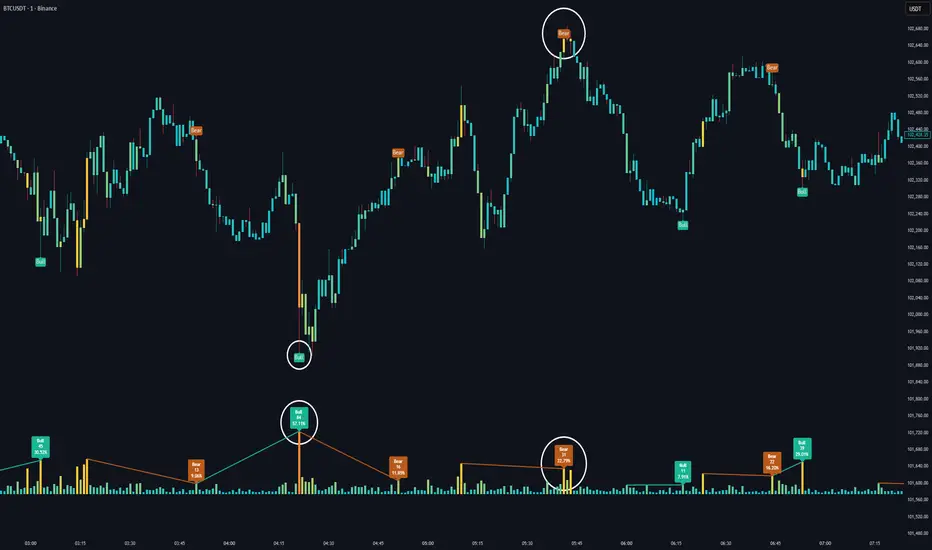
The Volume HeatMap Divergence [BigBeluga] is a smart volume visualization tool that overlays normalized volume data directly on the chart. Using a color heatmap from aqua to red, it transforms raw volume into an intuitive scale — highlighting areas of weak to intense market participation. Additionally, it detects volume-based divergences from price to signal potential reversals or exhaustion zones. Combined with clear visual labeling, this tool empowers traders with actionable volume insights.
🔵 CONCEPTS
🔵 FEATURES
🔵 HOW TO USE
🔵 CONCLUSION
Volume HeatMap Divergence [BigBeluga] merges heatmap-style volume visualization with intelligent divergence detection — giving traders a clean yet powerful edge. By revealing hidden disconnections between price and participation, it helps users spot exhaustion moves or hidden accumulation zones before the market reacts. Whether you’re a scalper, swing trader, or intraday strategist, this tool offers real-time clarity on who’s in control behind the candles.
The Volume HeatMap Divergence [BigBeluga] is a smart volume visualization tool that overlays normalized volume data directly on the chart. Using a color heatmap from aqua to red, it transforms raw volume into an intuitive scale — highlighting areas of weak to intense market participation. Additionally, it detects volume-based divergences from price to signal potential reversals or exhaustion zones. Combined with clear visual labeling, this tool empowers traders with actionable volume insights.
🔵 CONCEPTS
- Normalized Volume Heatmap: Volume is normalized to a 0–100% scale and visually represented as candles below the chart.
Pine Script® float vol = volume / ta.percentile_nearest_rank(volume, 1000, 100) * 100 - Bar Coloring: Price candles are dynamically colored based on volume intensity.
Volume Divergence Logic:
- Bullish Divergence: Price forms a lower low, but volume forms a higher low.
- Bearish Divergence: Price forms a higher high, but volume forms a lower high.
- Dynamic Detection Range: Customizable range ensures divergence signals are meaningful and not random.
- Volume Labels: Additional info on divergence bars shows both the actual volume and its normalized % score.
🔵 FEATURES
- Volume Heatmap Plot: Normalized volume values colored using a smooth gradient from aqua (low) to red (high).
- Price Bar Coloring: Candlesticks on the main chart adopt the same heatmap color based on volume.
- Divergence Detection:
Bullish divergence with label and low marker
Bearish divergence with label and high marker - Dual Divergence Labels:
On the volume plot: Direction (Bull/Bear), raw volume, and normalized %
On the price chart: Shape labels showing "Bull" or "Bear" at local highs/lows - Custom Inputs:
Divergence range (min & max), pivot detection distance (left/right)
Toggle to show/hide divergence labels, volume, and % text - Clear Bull/Bear Coloring: Fully customizable label and line colors for both bullish and bearish signals.
🔵 HOW TO USE
- Use the indicator as an overlay to monitor real-time volume strength using the heatmap color.
- Watch for divergence markers:
Bullish divergence: Candle shows higher volume while price makes a new low
Bearish divergence: Candle shows lower volume while price makes a new high - Use the volume info labels to verify the context of divergence:
Actual volume at divergence candle
Normalized % of that volume compared to past 1000 bars - Adjust pivot sensitivity using "Pivot Left" and "Pivot Right" to tune signal frequency and lag with a right pivot length.
- Use divergence zones as early warnings for potential reversals or trend shifts.
- Disable or customize labels in settings depending on your charting preferences.
🔵 CONCLUSION
Volume HeatMap Divergence [BigBeluga] merges heatmap-style volume visualization with intelligent divergence detection — giving traders a clean yet powerful edge. By revealing hidden disconnections between price and participation, it helps users spot exhaustion moves or hidden accumulation zones before the market reacts. Whether you’re a scalper, swing trader, or intraday strategist, this tool offers real-time clarity on who’s in control behind the candles.
オープンソーススクリプト
TradingViewの精神に則り、このスクリプトの作者はコードをオープンソースとして公開してくれました。トレーダーが内容を確認・検証できるようにという配慮です。作者に拍手を送りましょう!無料で利用できますが、コードの再公開はハウスルールに従う必要があります。
🔵Gain access to our powerful tools : bigbeluga.com/tv
🔵Join our free discord for updates : bigbeluga.com/discord
All scripts & content provided by BigBeluga are for informational & educational purposes only.
🔵Join our free discord for updates : bigbeluga.com/discord
All scripts & content provided by BigBeluga are for informational & educational purposes only.
免責事項
この情報および投稿は、TradingViewが提供または推奨する金融、投資、トレード、その他のアドバイスや推奨を意図するものではなく、それらを構成するものでもありません。詳細は利用規約をご覧ください。