OPEN-SOURCE SCRIPT
更新済 HEX Risk Metric (v0.2)
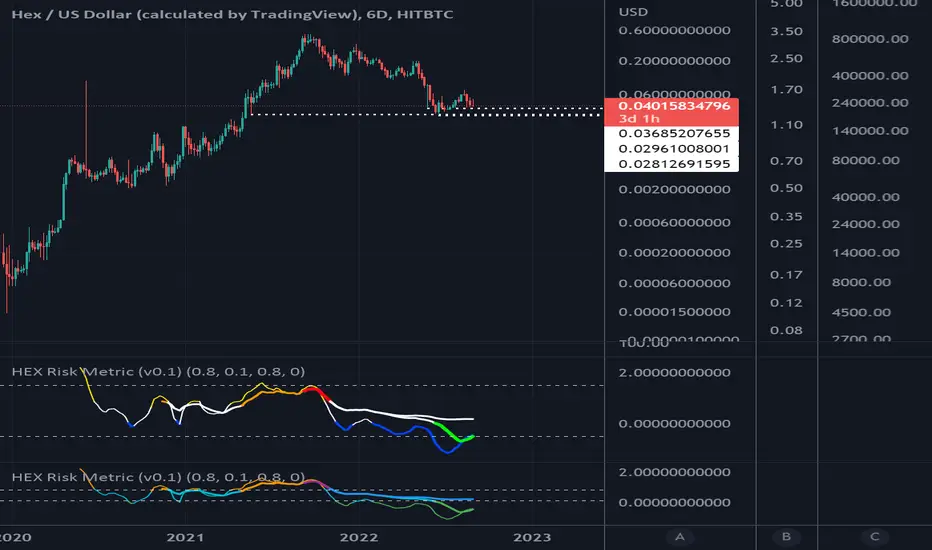
This indicator plots a "risk metric" based on the % increases of the following averages:
ema21, sma50, sma100, sma200, sma300, sma600.
Depending on the rolling 7-day percentage increase of this moving average, a value is assigned to each data point, then normalized to a common range.
This set of metrics attempts to represent data similar to that of a heat map.
Users can adjust filter top, filter bottom, and toggle on/off the different metrics within the set.
リリースノート
Better colors for signalsオープンソーススクリプト
TradingViewの精神に則り、このスクリプトの作者はコードをオープンソースとして公開してくれました。トレーダーが内容を確認・検証できるようにという配慮です。作者に拍手を送りましょう!無料で利用できますが、コードの再公開はハウスルールに従う必要があります。
免責事項
この情報および投稿は、TradingViewが提供または推奨する金融、投資、トレード、その他のアドバイスや推奨を意図するものではなく、それらを構成するものでもありません。詳細は利用規約をご覧ください。
オープンソーススクリプト
TradingViewの精神に則り、このスクリプトの作者はコードをオープンソースとして公開してくれました。トレーダーが内容を確認・検証できるようにという配慮です。作者に拍手を送りましょう!無料で利用できますが、コードの再公開はハウスルールに従う必要があります。
免責事項
この情報および投稿は、TradingViewが提供または推奨する金融、投資、トレード、その他のアドバイスや推奨を意図するものではなく、それらを構成するものでもありません。詳細は利用規約をご覧ください。