OPEN-SOURCE SCRIPT
更新済 VEMA_LTF
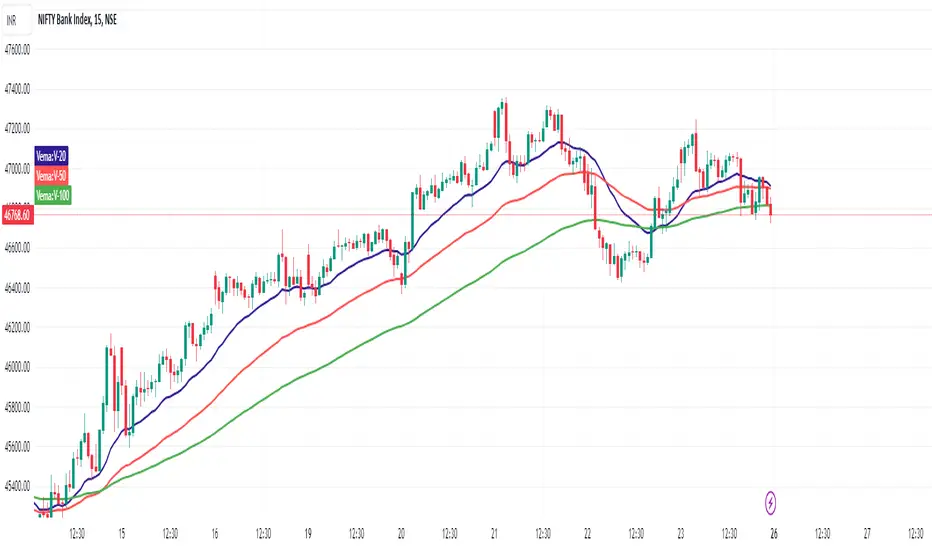
VEMA indicator is based on lower time frame volume data and it has 3 lines.
20, 50, 100 moving averages of the close price in each candle with the highest volume.
Effectively working fine and hence sharing.
Will Add more information with examples in next update
20, 50, 100 moving averages of the close price in each candle with the highest volume.
Effectively working fine and hence sharing.
Will Add more information with examples in next update
リリースノート
The script changed from a default 10-second time frame to 1-minute time frame. In case our subscription to TV supports sec based time frame - please set it to 10 sec.
In general observation on any time frame:
If the price crosses all three lines and closes above or below 20-VEMA, we can see good movement in the same direction in short period of time.
Analyze more charts with different time frames along with your favorite indicator and VEMA lines.
リリースノート
Minor correction as per coding guidelinesオープンソーススクリプト
TradingViewの精神に則り、このスクリプトの作者はコードをオープンソースとして公開してくれました。トレーダーが内容を確認・検証できるようにという配慮です。作者に拍手を送りましょう!無料で利用できますが、コードの再公開はハウスルールに従う必要があります。
免責事項
この情報および投稿は、TradingViewが提供または推奨する金融、投資、トレード、その他のアドバイスや推奨を意図するものではなく、それらを構成するものでもありません。詳細は利用規約をご覧ください。
オープンソーススクリプト
TradingViewの精神に則り、このスクリプトの作者はコードをオープンソースとして公開してくれました。トレーダーが内容を確認・検証できるようにという配慮です。作者に拍手を送りましょう!無料で利用できますが、コードの再公開はハウスルールに従う必要があります。
免責事項
この情報および投稿は、TradingViewが提供または推奨する金融、投資、トレード、その他のアドバイスや推奨を意図するものではなく、それらを構成するものでもありません。詳細は利用規約をご覧ください。