OPEN-SOURCE SCRIPT
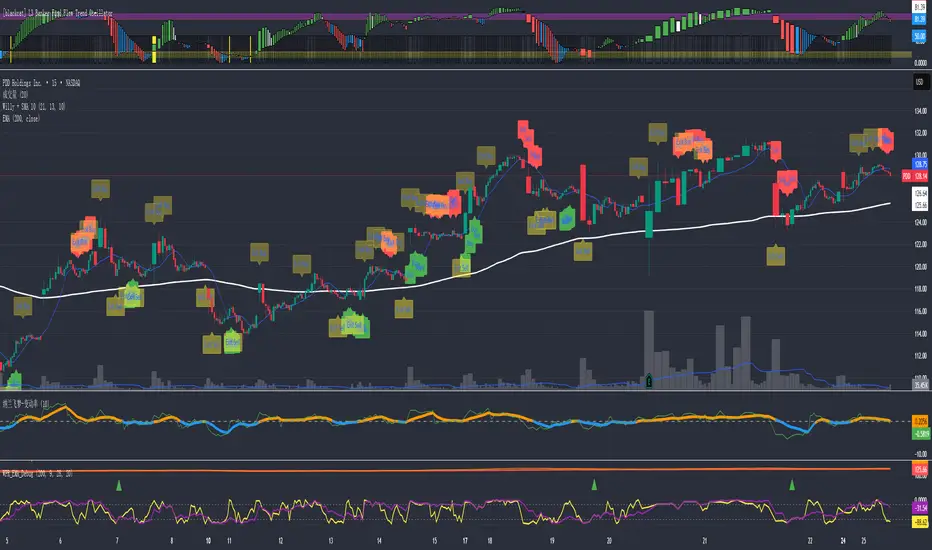
更新済 Optimized WPR Strategy with Filters (Debug)
Identifying Market Trends:
The 200-period EMA is used to determine the short-term trend of the market.
When the price is above the 200-period EMA, it suggests a potential bullish market and an uptrend, and the strategy will only look for buying opportunities.
When the price is below the 200-period EMA, it suggests a potential bearish market and a downtrend, and the strategy will only look for selling opportunities.
When the 200-period EMA intersects with the price, it indicates that the market may be in a directionless consolidation phase.
Identifying Potential Reversal Points:
The strategy employs two Williams %R (WPR) indicators: one with a 9-period (fast WPR) and another with a 28-period (slow WPR).
WPR is a momentum indicator used to identify overbought and oversold conditions in the market. Its value oscillates between -100 and 0, with values near -100 indicating oversold conditions and values near 0 indicating overbought conditions.
In an uptrend (when the price is above the 200 EMA), the strategy seeks buying opportunities when both WPR indicators cross above -80 (the oversold zone) from below. This is considered a bullish signal, suggesting the market may be about to rebound. Sell signals are ignored at this time.
In a downtrend (when the price is below the 200 EMA), the strategy seeks selling opportunities when both WPR indicators cross below -20 (the overbought zone) from above. This is considered a bearish signal, suggesting the market may be about to reverse downward. Buy signals are ignored at this time.
Summary:
In summary, this strategy first uses the 200-period EMA to determine the overall trend direction of the market. Then, within the confirmed trend direction, it utilizes the simultaneous crossing of the overbought or oversold zones by the dual WPR indicators to identify potential reversal points as entry signals for trading. The strategy emphasizes that trading signals are only valid when both WPR indicators meet the conditions.
リリースノート
dentifying Market Trends:The 200-period EMA is used to determine the short-term trend of the market.
When the price is above the 200-period EMA, it suggests a potential bullish market and an uptrend, and the strategy will only look for buying opportunities.
When the price is below the 200-period EMA, it suggests a potential bearish market and a downtrend, and the strategy will only look for selling opportunities.
When the 200-period EMA intersects with the price, it indicates that the market may be in a directionless consolidation phase.
Identifying Potential Reversal Points:
The strategy employs two Williams %R (WPR) indicators: one with a 9-period (fast WPR) and another with a 28-period (slow WPR).
WPR is a momentum indicator used to identify overbought and oversold conditions in the market. Its value oscillates between -100 and 0, with values near -100 indicating oversold conditions and values near 0 indicating overbought conditions.
In an uptrend (when the price is above the 200 EMA), the strategy seeks buying opportunities when both WPR indicators cross above -80 (the oversold zone) from below. This is considered a bullish signal, suggesting the market may be about to rebound. Sell signals are ignored at this time.
In a downtrend (when the price is below the 200 EMA), the strategy seeks selling opportunities when both WPR indicators cross below -20 (the overbought zone) from above. This is considered a bearish signal, suggesting the market may be about to reverse downward. Buy signals are ignored at this time.
Summary:
In summary, this strategy first uses the 200-period EMA to determine the overall trend direction of the market. Then, within the confirmed trend direction, it utilizes the simultaneous crossing of the overbought or oversold zones by the dual WPR indicators to identify potential reversal points as entry signals for trading. The strategy emphasizes that trading signals are only valid when both WPR indicators meet the conditions.
オープンソーススクリプト
TradingViewの精神に則り、このスクリプトの作者はコードをオープンソースとして公開してくれました。トレーダーが内容を確認・検証できるようにという配慮です。作者に拍手を送りましょう!無料で利用できますが、コードの再公開はハウスルールに従う必要があります。
免責事項
この情報および投稿は、TradingViewが提供または推奨する金融、投資、トレード、その他のアドバイスや推奨を意図するものではなく、それらを構成するものでもありません。詳細は利用規約をご覧ください。
オープンソーススクリプト
TradingViewの精神に則り、このスクリプトの作者はコードをオープンソースとして公開してくれました。トレーダーが内容を確認・検証できるようにという配慮です。作者に拍手を送りましょう!無料で利用できますが、コードの再公開はハウスルールに従う必要があります。
免責事項
この情報および投稿は、TradingViewが提供または推奨する金融、投資、トレード、その他のアドバイスや推奨を意図するものではなく、それらを構成するものでもありません。詳細は利用規約をご覧ください。