OPEN-SOURCE SCRIPT
更新済 Candle Theory
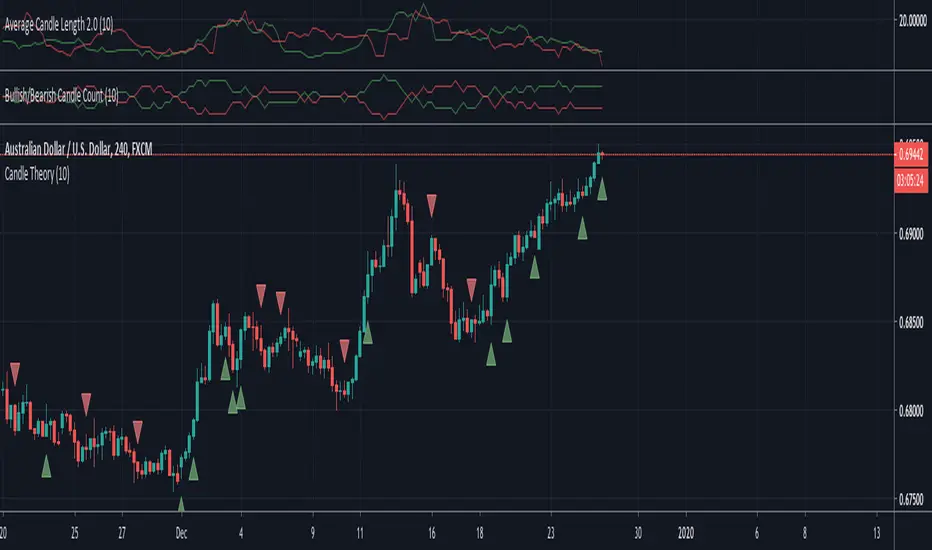
Description: The theory behind this script is that if within the last 10 candles, if the majority of them are green and the average length (wick to wick) of those majority green candles is greater than the average length of the minority red candles then it will signal that this is a bullish move within the market and signal you to buy. The opposite is true for bearish moves.
Inputs:
Inputs:
- Length - this allows you to decide how many candles to look back, default/recommended is 10
- Show First Signal In Series Only - using this indicator without this checked will show many more signals in a row. This allows you to just get a signal for the first candle that is the predicted bullish or bearish move
リリースノート
Adding in an alertcondition that allows you to set up one alert for short or long signals rather than having to set up two different alerts.オープンソーススクリプト
TradingViewの精神に則り、このスクリプトの作者はコードをオープンソースとして公開してくれました。トレーダーが内容を確認・検証できるようにという配慮です。作者に拍手を送りましょう!無料で利用できますが、コードの再公開はハウスルールに従う必要があります。
免責事項
この情報および投稿は、TradingViewが提供または推奨する金融、投資、トレード、その他のアドバイスや推奨を意図するものではなく、それらを構成するものでもありません。詳細は利用規約をご覧ください。
オープンソーススクリプト
TradingViewの精神に則り、このスクリプトの作者はコードをオープンソースとして公開してくれました。トレーダーが内容を確認・検証できるようにという配慮です。作者に拍手を送りましょう!無料で利用できますが、コードの再公開はハウスルールに従う必要があります。
免責事項
この情報および投稿は、TradingViewが提供または推奨する金融、投資、トレード、その他のアドバイスや推奨を意図するものではなく、それらを構成するものでもありません。詳細は利用規約をご覧ください。