OPEN-SOURCE SCRIPT
Short & Long Relative Strength
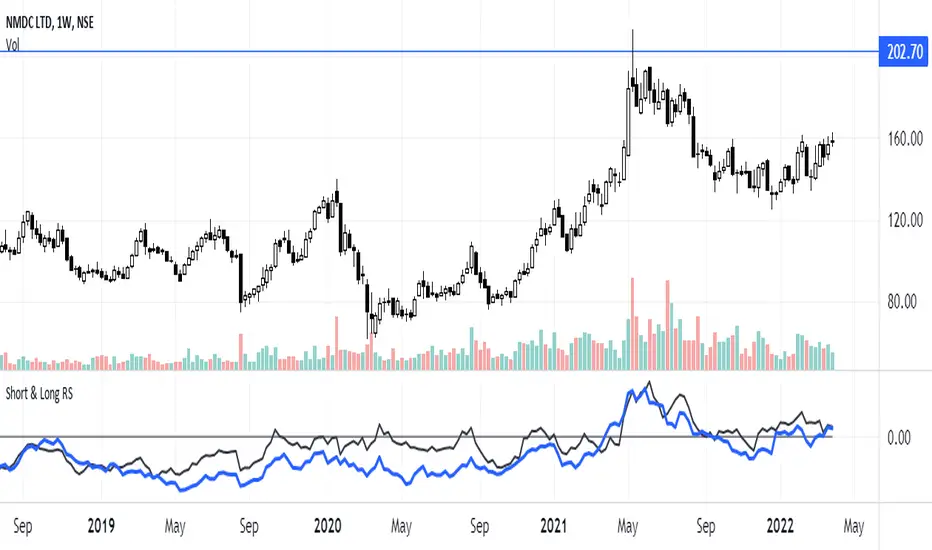
Relative Strength (RS) is a method of identifying stocks which are relatively stronger or weaker as compared the market as a whole or to a relevant benchmark.
To calculate the relative strength of a particular stock, divide the percentage change over some time period by the percentage change of a particular index over the same time period.
The value of RS Indicator oscillates around zero. If value of RS is above ZERO then security is outperforming the benchmark and if value of RS is below ZERO then security is outperforming the benchmark.
Here i have used two RS indicator lines in one indicator - Short Term RS (default value is 65) and Long Term RS (default value is 123).
I have set default benchmark index as Nifty 50 (NSE:NIFTY)
オープンソーススクリプト
TradingViewの精神に則り、このスクリプトの作者はコードをオープンソースとして公開してくれました。トレーダーが内容を確認・検証できるようにという配慮です。作者に拍手を送りましょう!無料で利用できますが、コードの再公開はハウスルールに従う必要があります。
免責事項
この情報および投稿は、TradingViewが提供または推奨する金融、投資、トレード、その他のアドバイスや推奨を意図するものではなく、それらを構成するものでもありません。詳細は利用規約をご覧ください。
オープンソーススクリプト
TradingViewの精神に則り、このスクリプトの作者はコードをオープンソースとして公開してくれました。トレーダーが内容を確認・検証できるようにという配慮です。作者に拍手を送りましょう!無料で利用できますが、コードの再公開はハウスルールに従う必要があります。
免責事項
この情報および投稿は、TradingViewが提供または推奨する金融、投資、トレード、その他のアドバイスや推奨を意図するものではなく、それらを構成するものでもありません。詳細は利用規約をご覧ください。