OPEN-SOURCE SCRIPT
Triple EMA Momentum Oscillator (TEMO) Histogram
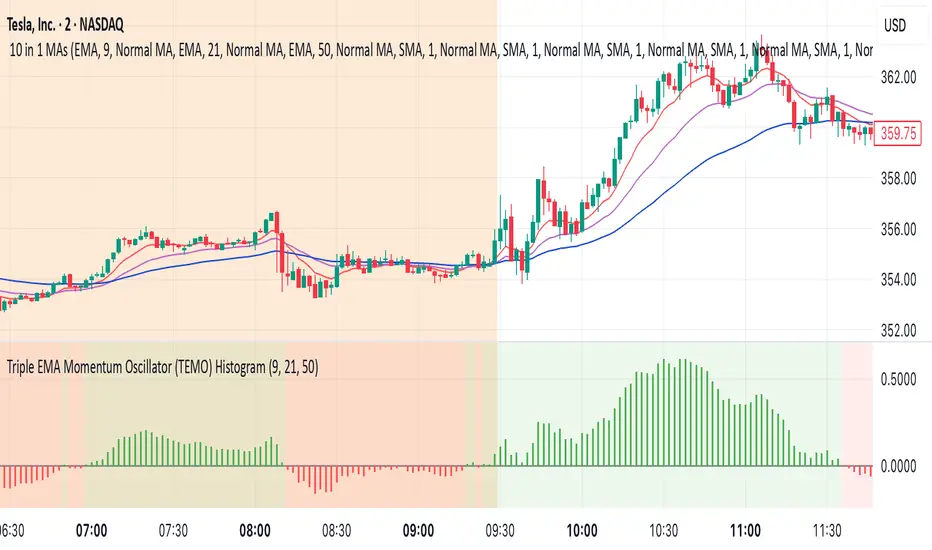
This Pine Script code replicates the Python indicator you provided, calculating the Triple EMA Momentum Oscillator (TEMO) and generating signals based on its value and momentum.
Explanation of the Code:
User Inputs:
Allows you to adjust the periods for the short, mid, and long EMAs.
Calculate EMAs:
Computes the Exponential Moving Averages for the specified periods.
Calculate EMA Spreads (Distances):
Finds the differences between the EMAs to understand the spread between them.
Calculate Spread Velocities:
Determines the change in spreads from the previous period, indicating momentum.
Composite Strength Score:
Weighted calculation of the spreads normalized by the EMA values.
Velocity Accelerator:
Weighted calculation of the velocities normalized by the EMA values.
Final TEMO Oscillator:
Combines the spread strength and velocity accelerator to create the TEMO.
Generate Signals:
Signals are generated when TEMO is positive and increasing (buy), or negative and decreasing (sell).
Plotting:
Zero Line: Helps visualize when TEMO crosses from positive to negative.
TEMO Oscillator: Plotted with green for positive values and red for negative values.
Signals: Displayed as a histogram to indicate buy (1) and sell (-1) signals.
Usage:
Buy Signal: When TEMO is above zero and increasing.
Sell Signal: When TEMO is below zero and decreasing.
Note: This oscillator helps identify momentum changes based on EMAs of different periods. It's useful for detecting trends and potential reversal points in the market.
オープンソーススクリプト
TradingViewの精神に則り、このスクリプトの作者はコードをオープンソースとして公開してくれました。トレーダーが内容を確認・検証できるようにという配慮です。作者に拍手を送りましょう!無料で利用できますが、コードの再公開はハウスルールに従う必要があります。
免責事項
この情報および投稿は、TradingViewが提供または推奨する金融、投資、トレード、その他のアドバイスや推奨を意図するものではなく、それらを構成するものでもありません。詳細は利用規約をご覧ください。
オープンソーススクリプト
TradingViewの精神に則り、このスクリプトの作者はコードをオープンソースとして公開してくれました。トレーダーが内容を確認・検証できるようにという配慮です。作者に拍手を送りましょう!無料で利用できますが、コードの再公開はハウスルールに従う必要があります。
免責事項
この情報および投稿は、TradingViewが提供または推奨する金融、投資、トレード、その他のアドバイスや推奨を意図するものではなく、それらを構成するものでもありません。詳細は利用規約をご覧ください。