OPEN-SOURCE SCRIPT
更新済 ORB + Premarket High/Low
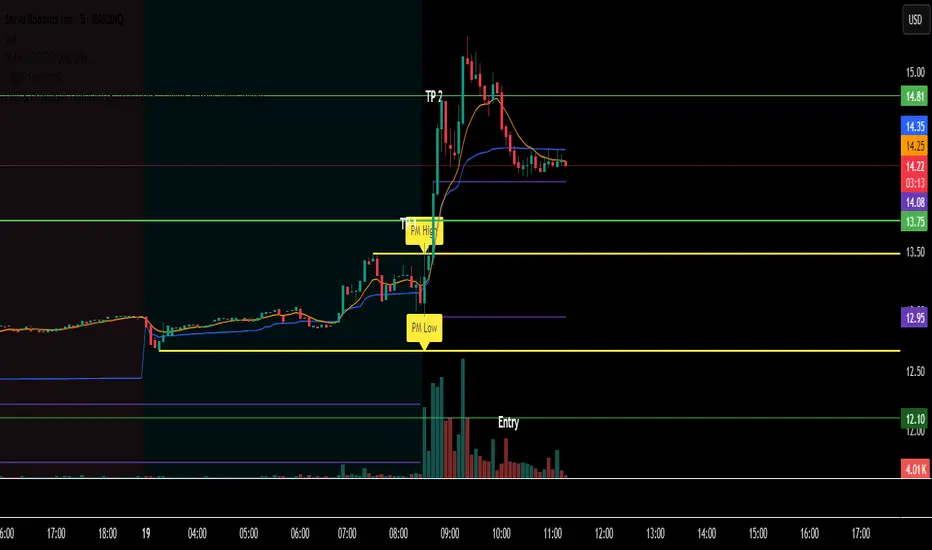
indicator that show opening range break plus premarket highs and lows
リリースノート
Indicator DescriptionThis indicator is a key part of a trading strategy focused on breakouts and breakdowns. It automatically marks two important price levels:
Premarket High and Low: The indicator identifies the highest and lowest prices reached during the premarket session (4:00 AM to 9:30 AM EST). It then draws these levels as horizontal lines that extend through the rest of the trading day.
Morning Open: It also highlights the first 15 minutes of the regular market open, which is what you use as your "Opening Range Breakout" (ORB) zone. Make sure to change this in settings as 9:30 to 9:45 EST
By clearly plotting these premarket and opening range levels on your chart, this tool helps you visualize key support and resistance zones, which is crucial for trading breakout and breakdown strategies.
オープンソーススクリプト
TradingViewの精神に則り、このスクリプトの作者はコードをオープンソースとして公開してくれました。トレーダーが内容を確認・検証できるようにという配慮です。作者に拍手を送りましょう!無料で利用できますが、コードの再公開はハウスルールに従う必要があります。
免責事項
この情報および投稿は、TradingViewが提供または推奨する金融、投資、トレード、その他のアドバイスや推奨を意図するものではなく、それらを構成するものでもありません。詳細は利用規約をご覧ください。
オープンソーススクリプト
TradingViewの精神に則り、このスクリプトの作者はコードをオープンソースとして公開してくれました。トレーダーが内容を確認・検証できるようにという配慮です。作者に拍手を送りましょう!無料で利用できますが、コードの再公開はハウスルールに従う必要があります。
免責事項
この情報および投稿は、TradingViewが提供または推奨する金融、投資、トレード、その他のアドバイスや推奨を意図するものではなく、それらを構成するものでもありません。詳細は利用規約をご覧ください。