OPEN-SOURCE SCRIPT
Support & Resistance
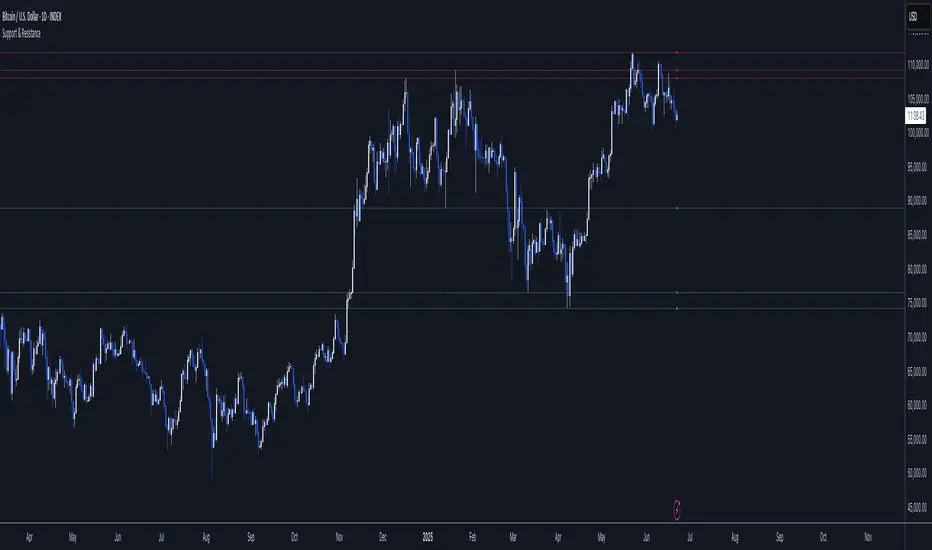
What is this script ?
Pivot points are tools used to identify potential support and resistance levels in trading. They are calculated using the previous period’s high, low, and close prices. This script leverages pivot points to plot up to four support levels and four resistance levels, helping traders visualize key price zones.
How to Use the Script?
Support and resistance levels represent price zones where significant liquidity often exists due to past price interactions. These levels are critical for traders to:
- Assess Trend Continuation or Reversal: Prices may pause, reverse, or break through at these levels, signaling potential trend changes or continuations.
- Manage Risk: Support and resistance levels are ideal for placing stop-loss orders or setting profit targets, as they indicate areas where price reactions are likely.
- Plan Entries and Exits: Traders can buy near support levels, sell near resistance levels, or trade breakouts when prices move decisively beyond these zones.
オープンソーススクリプト
TradingViewの精神に則り、このスクリプトの作者はコードをオープンソースとして公開してくれました。トレーダーが内容を確認・検証できるようにという配慮です。作者に拍手を送りましょう!無料で利用できますが、コードの再公開はハウスルールに従う必要があります。
免責事項
この情報および投稿は、TradingViewが提供または推奨する金融、投資、トレード、その他のアドバイスや推奨を意図するものではなく、それらを構成するものでもありません。詳細は利用規約をご覧ください。
オープンソーススクリプト
TradingViewの精神に則り、このスクリプトの作者はコードをオープンソースとして公開してくれました。トレーダーが内容を確認・検証できるようにという配慮です。作者に拍手を送りましょう!無料で利用できますが、コードの再公開はハウスルールに従う必要があります。
免責事項
この情報および投稿は、TradingViewが提供または推奨する金融、投資、トレード、その他のアドバイスや推奨を意図するものではなく、それらを構成するものでもありません。詳細は利用規約をご覧ください。