OPEN-SOURCE SCRIPT
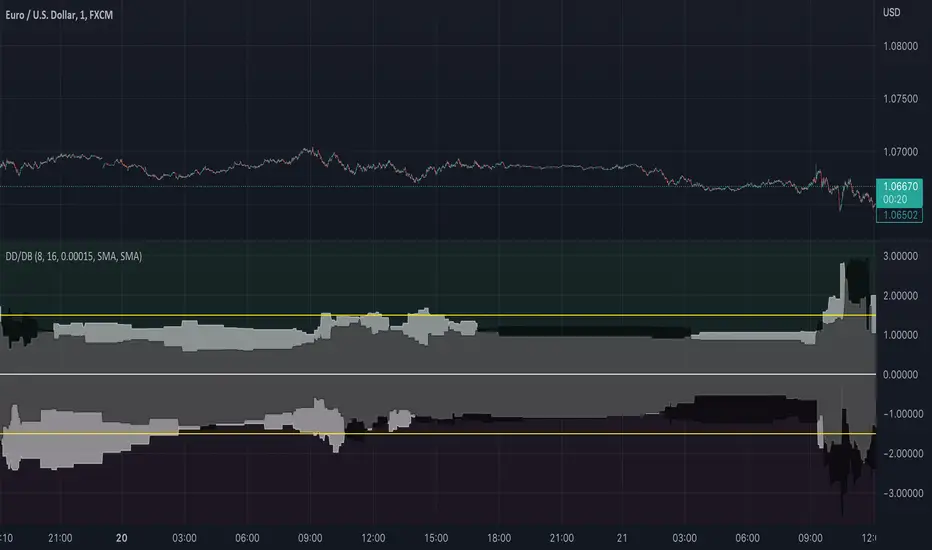
Drawdown and Drawback || Ranging
Hey!
So this indicator tries to spot ranges;
Above the zero line is the data from green candles and below the zero line is the data from the red candles;
When the white area is > than the black area, it indicates that the DrawBack is higher than the DrawDown;
This might work counterintuitively for some people because, for a bullish candle, this means it has to go down for the indicator to recognize it as “good”/ see it as a DrawBack value;
The same is true for a bearish candle, the price has to move up after for it to be seen as a DrawBack value;
There are a few input values:
Length_: This is how many bars a candle gets for the price to move in, the default is 8 bars, so after a bar is formed, from the following 8 bars the DrawBack/DrawDown is saved;
EMA_Length: This is the EMA length, you can change the EMA length and also the MA variant, so you have full flexibility about what might work best for you;
RB_Size: This is how many points a Real Body of a candle has to have before it gets registered within the indicator, what I found it, is that if you put this too low your data gets ruined by candles that have 1-5 points if you use it on a low TimeFrame, but if you want to use it on higher timeframes you maybe have to make the default a bit higher.
Everything is plotted with an Offset of 1, I like it this way so you get a realistic view of the market as you will -most likely- place trades on the next candle either way not on the current candle. But that is just my opinion.
I also added 2 yellow Hlines for visual purposes to see if they were within a certain boundary, see if these add anything for yourself, because they can also make it look a bit messy;
If you have any questions about the code or the indicator itself, feel free to ask them!
I hope it helps at least one person ;)
オープンソーススクリプト
TradingViewの精神に則り、このスクリプトの作者はコードをオープンソースとして公開してくれました。トレーダーが内容を確認・検証できるようにという配慮です。作者に拍手を送りましょう!無料で利用できますが、コードの再公開はハウスルールに従う必要があります。
免責事項
この情報および投稿は、TradingViewが提供または推奨する金融、投資、トレード、その他のアドバイスや推奨を意図するものではなく、それらを構成するものでもありません。詳細は利用規約をご覧ください。
オープンソーススクリプト
TradingViewの精神に則り、このスクリプトの作者はコードをオープンソースとして公開してくれました。トレーダーが内容を確認・検証できるようにという配慮です。作者に拍手を送りましょう!無料で利用できますが、コードの再公開はハウスルールに従う必要があります。
免責事項
この情報および投稿は、TradingViewが提供または推奨する金融、投資、トレード、その他のアドバイスや推奨を意図するものではなく、それらを構成するものでもありません。詳細は利用規約をご覧ください。