OPEN-SOURCE SCRIPT
更新済 EMA 50 & 200 (TF-specific)
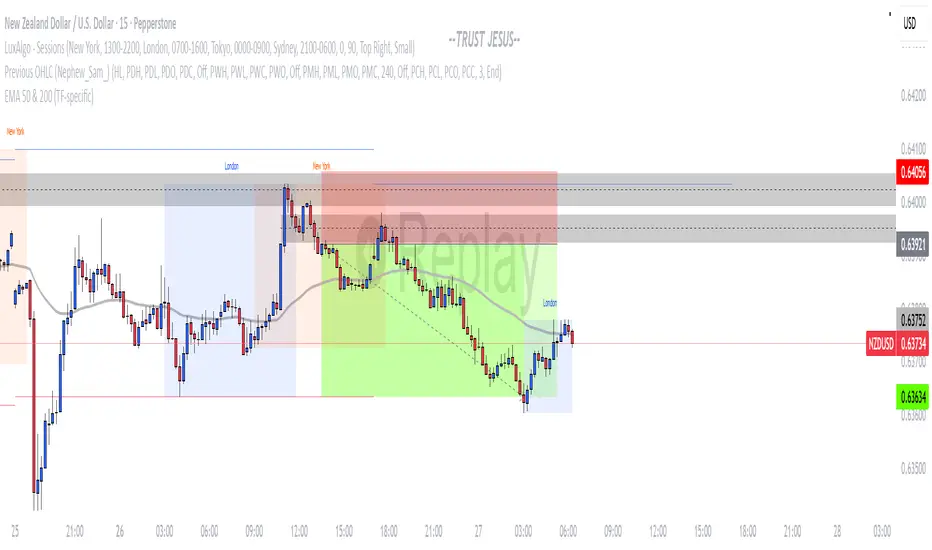
This script plots EMA 50 and EMA 200 only on the timeframes where they matter most:
EMA 50 (gray): visible on 1H, 4H, and 12H charts – often used by intraday traders.
EMA 200 (black): visible on Daily and Weekly charts – a classic long-term trend indicator.
🔹 Why use it?
Avoids clutter by showing each EMA only on the relevant timeframe.
Helps align intraday trading with higher timeframe trends.
Simple, clean, and effective for both swing and day trading.
リリースノート
This script plots EMA 50 and EMA 200 only on the timeframes where they matter most:EMA 50 (gray): visible on 5m, 15m, 30m, 1H, 4H, and 12H charts – often used by intraday traders.
EMA 200 (black): visible on Daily and Weekly charts – a classic long-term trend indicator.
🔹 Why use it?
Avoids clutter by showing each EMA only on the relevant timeframe.
Helps align intraday trading with higher timeframe trends.
Simple, clean, and effective for both swing and day trading.
オープンソーススクリプト
TradingViewの精神に則り、この作者はスクリプトのソースコードを公開しているので、その内容を理解し検証することができます。作者に感謝です!無料でお使いいただけますが、このコードを投稿に再利用する際にはハウスルールに従うものとします。
免責事項
これらの情報および投稿は、TradingViewが提供または保証する金融、投資、取引、またはその他の種類のアドバイスや推奨を意図したものではなく、またそのようなものでもありません。詳しくは利用規約をご覧ください。
オープンソーススクリプト
TradingViewの精神に則り、この作者はスクリプトのソースコードを公開しているので、その内容を理解し検証することができます。作者に感謝です!無料でお使いいただけますが、このコードを投稿に再利用する際にはハウスルールに従うものとします。
免責事項
これらの情報および投稿は、TradingViewが提供または保証する金融、投資、取引、またはその他の種類のアドバイスや推奨を意図したものではなく、またそのようなものでもありません。詳しくは利用規約をご覧ください。