OPEN-SOURCE SCRIPT
VIX:VIX3M Ratio
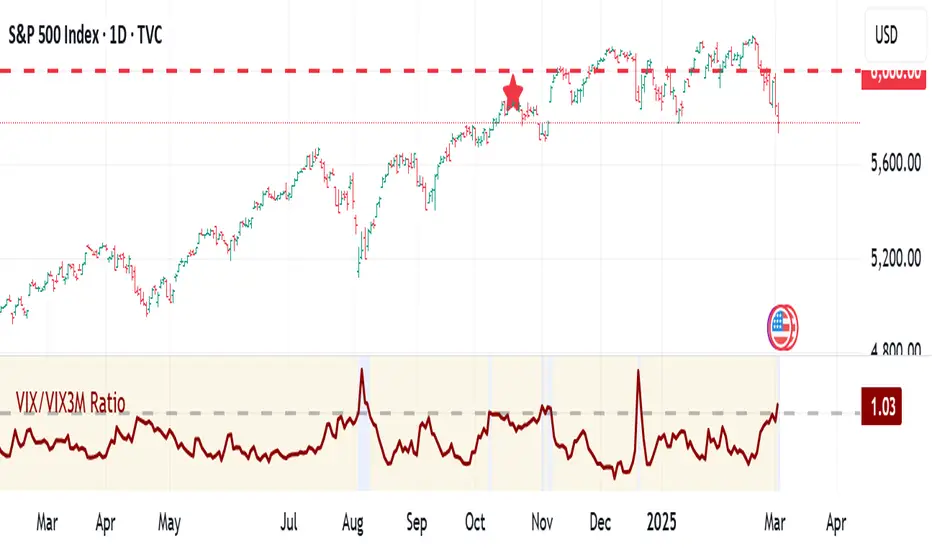
The VIX/VIX3M Ratio indicator compares the short-term (1-month) volatility index (VIX) to the medium-term (3-month) volatility index (VIX3M). This ratio provides insights into the market's volatility expectations across different time horizons.
Key Interpretations:
Potential Trading Insights:
Key Interpretations:
- Ratio > 1: Short-term volatility expectations are higher than 3-month expectations
- Ratio = 1: Short-term and medium-term volatility expectations are aligned
- Ratio < 1: Medium-term volatility expectations are higher than short-term expectations
Potential Trading Insights:
- A rising ratio may indicate increasing near-term market uncertainty
- Significant deviations from 1.0 can signal potential market stress or changing risk perceptions
- Traders use this to gauge the term structure of market volatility
オープンソーススクリプト
TradingViewの精神に則り、このスクリプトの作者はコードをオープンソースとして公開してくれました。トレーダーが内容を確認・検証できるようにという配慮です。作者に拍手を送りましょう!無料で利用できますが、コードの再公開はハウスルールに従う必要があります。
免責事項
この情報および投稿は、TradingViewが提供または推奨する金融、投資、トレード、その他のアドバイスや推奨を意図するものではなく、それらを構成するものでもありません。詳細は利用規約をご覧ください。
オープンソーススクリプト
TradingViewの精神に則り、このスクリプトの作者はコードをオープンソースとして公開してくれました。トレーダーが内容を確認・検証できるようにという配慮です。作者に拍手を送りましょう!無料で利用できますが、コードの再公開はハウスルールに従う必要があります。
免責事項
この情報および投稿は、TradingViewが提供または推奨する金融、投資、トレード、その他のアドバイスや推奨を意図するものではなく、それらを構成するものでもありません。詳細は利用規約をご覧ください。