OPEN-SOURCE SCRIPT
更新済 Follow Trend - Wall Street Strategy
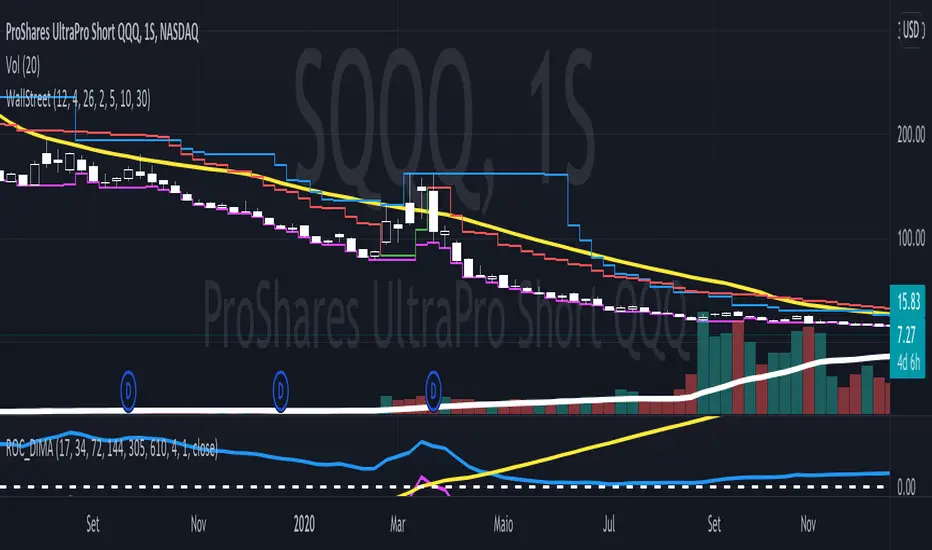
It is a mix of three common indicators, they are The High band level of Donchian Channel, 6 emas (17, 34, 72, 144, 200 and 305), and 2 VStop with different multipliers.
We search stocks are going higher and higher each time. So we look at the High-level Donchian band and if the price made a little correction and didn't touch the VStop indicator and, the price is higher than all the ema's. So we try to buy the stocks when it pass through the last highest price.
The Vstop-short we use to stocks and commodities.
The VStop-long, we use to Bonds and Reits.
In order to help, there is a triangle when the price crossover any VStop, at least the half of Donchian period.
リリースノート
I forgot one of the ema'sリリースノート
There are some other possibilities about crossing price and VStop-short and VStop-long that I was forgot. Now it is complete!リリースノート
Some wrong indication on it touch the VStopリリースノート
EMA's change color to green when the price is upper than ema's and they are red when the price is lower than they.リリースノート
1 -I put the correct name of each ema in plot and now they are the same at the user display2- All the important values are showing at the end . There is a resume of our strategy, Its show the start price (the highest value + 0.01), the short-stop value, the long-stop value and its brings if all the price is higher then all ema's ploted. If one of the ema's is above the price, it will show the ema's problem and don;t shows the our strategy value.
リリースノート
Legend text now is white, not black.リリースノート
User can choose DarkTheme or LightTheme on the legendsリリースノート
Now its show the relation risc vs return at each ATRリリースノート
In some stocks, we don't have enough data to calculate large ema's, so in these cases, the strategy shows Ema's Bad but it isn't true. we don't have enough data to calculate it. In those cases, we will ignore them. When the close price was below ema our script says it was bad, but it isn't true either. It is irrelevant for our strategy because the price along the week was above the ema, so now we calculate the ema using the high price along the week.
リリースノート
I changed some indicators colors. I added dashed extend lines to show here are the vstop, vstop2 and buyprice.リリースノート
DarkTheme is working nowSubtract some indicators that we didn't use anymore.
Now is more simply. They are project to weekly graphcs.
リリースノート
Correction on value of Donchian Bottomリリースノート
Change Colors on Donchian Bottom and EMA2リリースノート
Change Line Stylesリリースノート
The Vstop line has two color. When the vstop price is less than close price the line will be green and when the vstop price is higher then close price it will be red.オープンソーススクリプト
TradingViewの精神に則り、このスクリプトの作者はコードをオープンソースとして公開してくれました。トレーダーが内容を確認・検証できるようにという配慮です。作者に拍手を送りましょう!無料で利用できますが、コードの再公開はハウスルールに従う必要があります。
免責事項
この情報および投稿は、TradingViewが提供または推奨する金融、投資、トレード、その他のアドバイスや推奨を意図するものではなく、それらを構成するものでもありません。詳細は利用規約をご覧ください。
オープンソーススクリプト
TradingViewの精神に則り、このスクリプトの作者はコードをオープンソースとして公開してくれました。トレーダーが内容を確認・検証できるようにという配慮です。作者に拍手を送りましょう!無料で利用できますが、コードの再公開はハウスルールに従う必要があります。
免責事項
この情報および投稿は、TradingViewが提供または推奨する金融、投資、トレード、その他のアドバイスや推奨を意図するものではなく、それらを構成するものでもありません。詳細は利用規約をご覧ください。