OPEN-SOURCE SCRIPT
2band
Hello traders
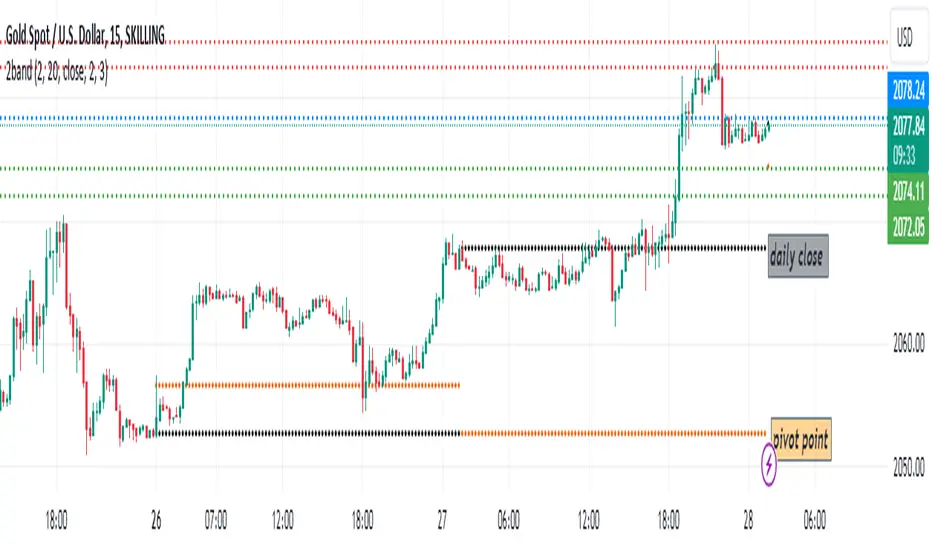
In this script, I have defined two bands with a deviation of 2 and 3
I designed the setup so that the upper lines represent red resistance, the lower lines represent green support, and the blue line represents the average price of the previous 20 candles in each time frame.
This code can be used mostly in time frames above 30 minutes and somehow predict possible price targets.
For example, if the price closes above the blue line in the one-hour time frame, the two fixed lines above are considered as targets and vice versa.
I have also added the pivot point calculation formula in orange
Most importantly, I added the closing price of the previous days in black
I hope it will be used by dear traders and you will support more for new works.
オープンソーススクリプト
TradingViewの精神に則り、このスクリプトの作者はコードをオープンソースとして公開してくれました。トレーダーが内容を確認・検証できるようにという配慮です。作者に拍手を送りましょう!無料で利用できますが、コードの再公開はハウスルールに従う必要があります。
免責事項
この情報および投稿は、TradingViewが提供または推奨する金融、投資、トレード、その他のアドバイスや推奨を意図するものではなく、それらを構成するものでもありません。詳細は利用規約をご覧ください。
オープンソーススクリプト
TradingViewの精神に則り、このスクリプトの作者はコードをオープンソースとして公開してくれました。トレーダーが内容を確認・検証できるようにという配慮です。作者に拍手を送りましょう!無料で利用できますが、コードの再公開はハウスルールに従う必要があります。
免責事項
この情報および投稿は、TradingViewが提供または推奨する金融、投資、トレード、その他のアドバイスや推奨を意図するものではなく、それらを構成するものでもありません。詳細は利用規約をご覧ください。