OPEN-SOURCE SCRIPT
MTF CCI using EMAs
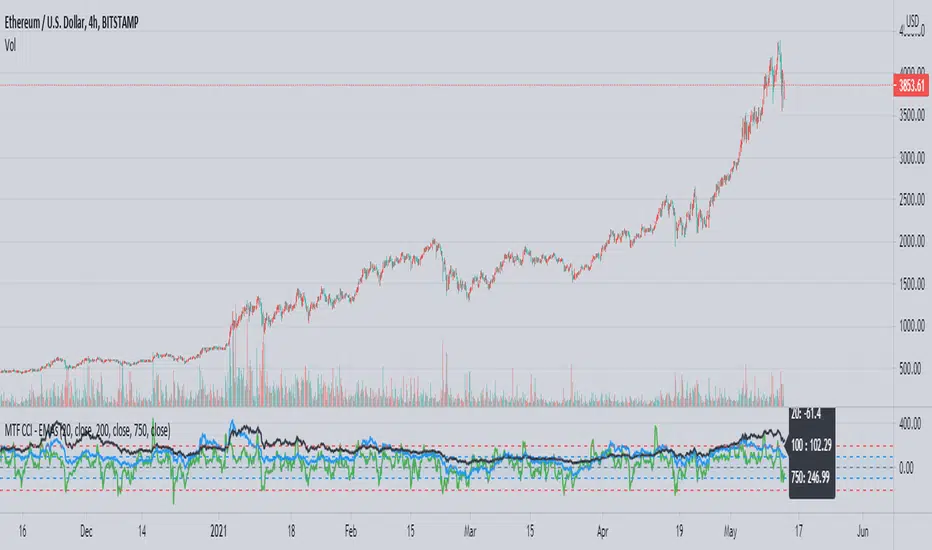
This is a CCI script adapted from 'CCI w EMA by Rick3712' which removes the EMA of the CCI and adds different sized CCI results to the same plot. An info box is also added for easy reference of current values.
CCI is a useful way to see the price's relation to moving averages in a different way, and being able to see the trend strength over time using the larger CCI allows a trader to make better informed decisions when reaching oversold or overbought conditions in relation to the shorter EMAs, such as the 20. You can also see patterns in a trend's strength easier by comparing the movements and levels to find likely areas of a pullback or buying opportunity.
In the example you can see a common level in ETH's parabolic movement on the 4h 750 EMA and 200 EMA that indicates a likely correction area.
オープンソーススクリプト
TradingViewの精神に則り、このスクリプトの作者はコードをオープンソースとして公開してくれました。トレーダーが内容を確認・検証できるようにという配慮です。作者に拍手を送りましょう!無料で利用できますが、コードの再公開はハウスルールに従う必要があります。
免責事項
この情報および投稿は、TradingViewが提供または推奨する金融、投資、トレード、その他のアドバイスや推奨を意図するものではなく、それらを構成するものでもありません。詳細は利用規約をご覧ください。
オープンソーススクリプト
TradingViewの精神に則り、このスクリプトの作者はコードをオープンソースとして公開してくれました。トレーダーが内容を確認・検証できるようにという配慮です。作者に拍手を送りましょう!無料で利用できますが、コードの再公開はハウスルールに従う必要があります。
免責事項
この情報および投稿は、TradingViewが提供または推奨する金融、投資、トレード、その他のアドバイスや推奨を意図するものではなく、それらを構成するものでもありません。詳細は利用規約をご覧ください。