INVITE-ONLY SCRIPT
更新済 MarketSniffer B
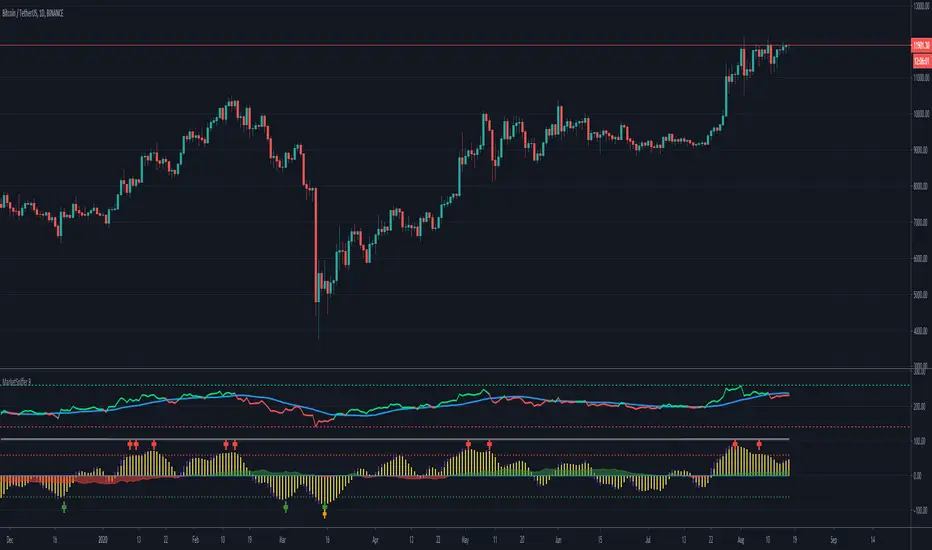
MarketSniffer B is a custom made indicator made by 2 friends that combined 2 strategies to make 1 indicator. It can detect good moments to buy and sell based on our strategy.
The indicator gives the same signals als marketsniffer A but has a diffrent way of showing it by using a histogram to make the momentum more clear when a buy / sell signal will be printed.
Marketsniffer B can be used in any market since its for a big part based on momentum. Although we recommend using it in the crypto market since it was tested and mainly made for crypto.
How to use it: MarketSniffer B can be used in many ways, own strategies can be made.
Example strategy: Lower timeframes (anything below the 1d) if the price is trading above the yellow 200 EMA, take the buy signals. If its trading below the 200 ema and you see a sell signal then sell / short
Example strategy: Higher timeframes (anything above the 1d) Any timeframe above the 1d, the 200 ema rule doesn't exist. Any buy signals should be good for taking a spot position. The sell signals therfore are NOT short signals but sell signals. Its just points to take profit from the buy signal.
Example strategy: Divergences and trendlines can be drawn on the waves as strategy. This indicator also had a RSI with EMA that can be used for this.
Its recommended to use the small timeframe signals (anything below 1d) for leverage trading. Any signals above 1day timeframe should be spot trading.
This indicator should be used in combination with MarketSniffer A
Use the link on our profile to get acces to this indicator.
リリースノート
Added more alerts and added the alert message招待専用スクリプト
このスクリプトは作者が承認したユーザーのみアクセス可能です。使用するにはアクセス申請をして許可を得る必要があります。通常は支払い後に承認されます。詳細は下記の作者の指示に従うか、Market-Snifferに直接お問い合わせください。
TradingViewは、作者を完全に信頼し、スクリプトの動作を理解していない限り、有料スクリプトの購入・使用を推奨しません。コミュニティスクリプトには無料のオープンソースの代替が多数あります。
作者の指示
免責事項
この情報および投稿は、TradingViewが提供または推奨する金融、投資、トレード、その他のアドバイスや推奨を意図するものではなく、それらを構成するものでもありません。詳細は利用規約をご覧ください。
招待専用スクリプト
このスクリプトは作者が承認したユーザーのみアクセス可能です。使用するにはアクセス申請をして許可を得る必要があります。通常は支払い後に承認されます。詳細は下記の作者の指示に従うか、Market-Snifferに直接お問い合わせください。
TradingViewは、作者を完全に信頼し、スクリプトの動作を理解していない限り、有料スクリプトの購入・使用を推奨しません。コミュニティスクリプトには無料のオープンソースの代替が多数あります。
作者の指示
免責事項
この情報および投稿は、TradingViewが提供または推奨する金融、投資、トレード、その他のアドバイスや推奨を意図するものではなく、それらを構成するものでもありません。詳細は利用規約をご覧ください。