PROTECTED SOURCE SCRIPT
MACD MTF
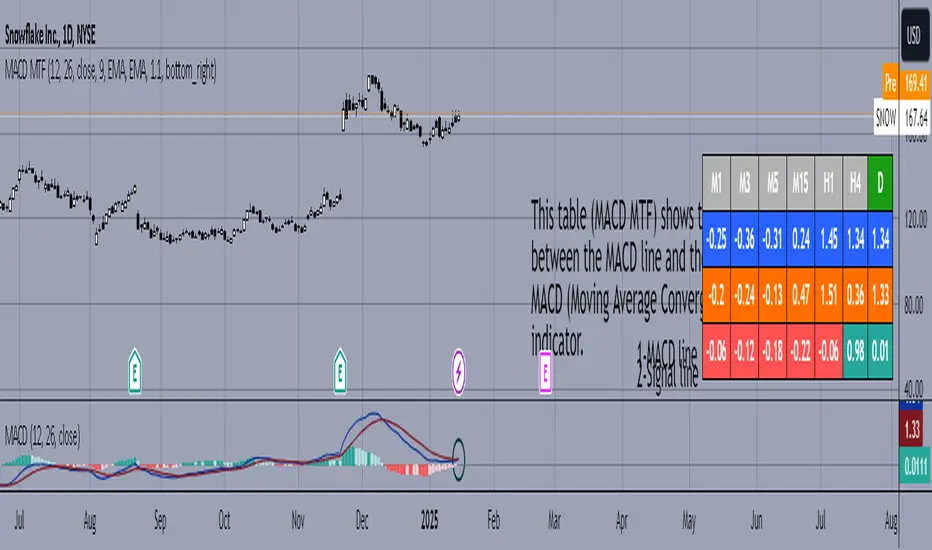
This table is a technical indicator that shows the proximity between the MACD line and the signal line of the multitemporal MACD (Moving Average Convergence Divergence) indicator. When the crossover is bullish, the timeframe will light up in green, and vice versa, if the crossover is bearish, the timeframe will light up in red. With this table, we can save time when detecting opportunities, as with one glance, we can spot potential MACD crossovers (which tend to indicate price action inflection points).
Esta tabla es un indicador técnico que muestra la proximidad entre la línea MACD y la línea de señal del indicador MACD (Moving Average Convergence Divergence) multitemporalmente. Cuando el cruce es alcista la temporalidad se iluminará en verde, y viceversa, si el cruce es bajista la temporalidad se iluminará en rojo. Con esta tabla podremos ahorrar tiempo a la hora de detectar oportunidades, pues de un vistazo podremos detectar posibles cruces de MACD (tienden a señalar puntos de inflexión en la acción de precio)
Esta tabla es un indicador técnico que muestra la proximidad entre la línea MACD y la línea de señal del indicador MACD (Moving Average Convergence Divergence) multitemporalmente. Cuando el cruce es alcista la temporalidad se iluminará en verde, y viceversa, si el cruce es bajista la temporalidad se iluminará en rojo. Con esta tabla podremos ahorrar tiempo a la hora de detectar oportunidades, pues de un vistazo podremos detectar posibles cruces de MACD (tienden a señalar puntos de inflexión en la acción de precio)
保護スクリプト
このスクリプトのソースコードは非公開で投稿されています。 ただし、制限なく自由に使用できます – 詳細はこちらでご確認ください。
📖Revista El Especulador:
drive.google.com/file/d/1Fs8l9xSpZIy5haCb5l0HWzgeAanOifs_/view?usp=drivesdk
👉t.me/ElEspeculador96 (Telegram)
drive.google.com/file/d/1Fs8l9xSpZIy5haCb5l0HWzgeAanOifs_/view?usp=drivesdk
👉t.me/ElEspeculador96 (Telegram)
免責事項
この情報および投稿は、TradingViewが提供または推奨する金融、投資、トレード、その他のアドバイスや推奨を意図するものではなく、それらを構成するものでもありません。詳細は利用規約をご覧ください。