PROTECTED SOURCE SCRIPT
Scott’s ATR volatility histogram with smoothing
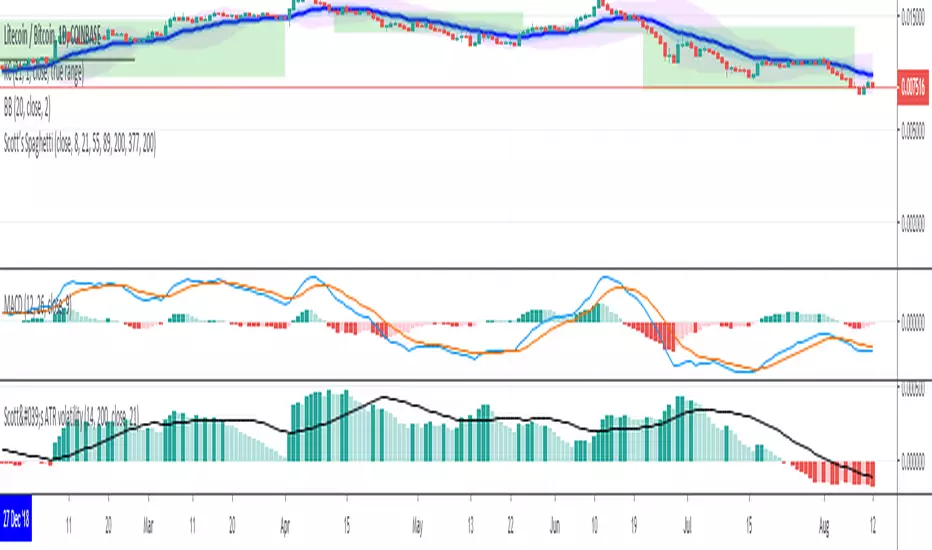
ATR shows volatility. The sma of the ATR gives a base line for whether volatility is increasing or decreasing. When ATR passes below the sma, the histogram goes red and shows that volatility is lower than the average volatilty over the last 200 (default) periods. The sma represents the zero line. I have added a 'smoothing' sma to the histogram values because it will help as a trade entry filter.... "Is the current volatility expansion (or contraction) momentum increasing or decreasing at this time" When the histogram value is above the smoothing line, volatility expansion momentum is increasing: a confirmation that the buy signal (derived from another indicator) is valid. Volatility expansion momentum also serves as a valid short entry confirmation. Volatility contraction momentum conversely tells one that a trend is not developing.
保護スクリプト
このスクリプトのソースコードは非公開で投稿されています。 ただし、制限なく自由に使用できます – 詳細はこちらでご確認ください。
免責事項
この情報および投稿は、TradingViewが提供または推奨する金融、投資、トレード、その他のアドバイスや推奨を意図するものではなく、それらを構成するものでもありません。詳細は利用規約をご覧ください。
保護スクリプト
このスクリプトのソースコードは非公開で投稿されています。 ただし、制限なく自由に使用できます – 詳細はこちらでご確認ください。
免責事項
この情報および投稿は、TradingViewが提供または推奨する金融、投資、トレード、その他のアドバイスや推奨を意図するものではなく、それらを構成するものでもありません。詳細は利用規約をご覧ください。