Equity Bond Currency Dashboard
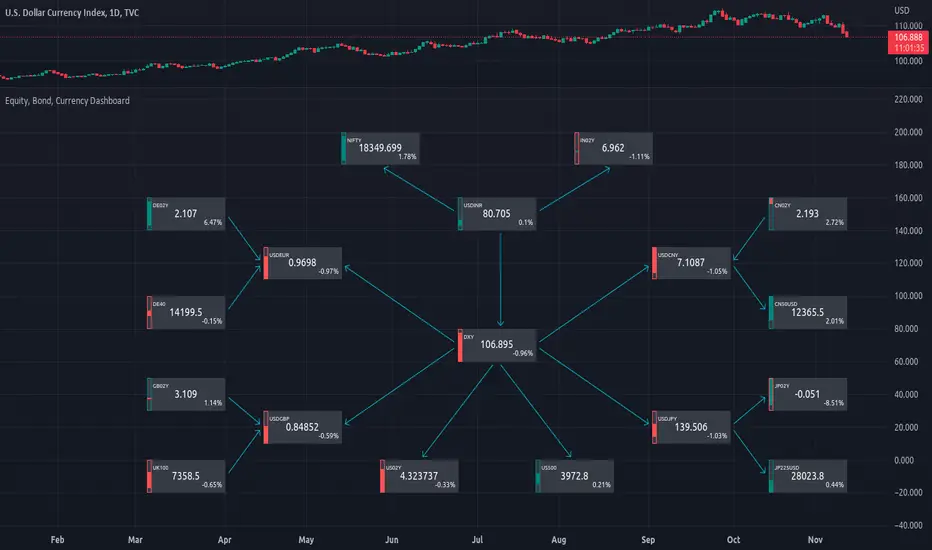
Depicts demand-flow between Equities, Bonds and Currencies of 6 countries. Useful in tracking the flow of smart money and checking the dynamics of inter-connected markets.
Principle:
DXY lies at the heart of the diagram with usd-currency pairs of 5 countries connected to it. When demand for a currency increases it strengthens against Dollar. This is depicted by a line from DXY to the currency indicating demand flow from Dollar to the currency (DXY is only an indicative symbol for Dollar, the currency may not be part of the dollar index). Similarly when Dollar strengthens against the currency, demand flow is depicted by a line from the currency to DXY. Currency blocks are connected to Equity and Bond Yields of the respective countries. Equities and Bonds, when bought, takes the demand from the respective currencies and vice versa.
Overall, the demand flows in the direction of arrows. The flow is incomplete without commodities, import/export, interest/inflation rates of countries, however, the diagram most of the times explains why an asset class is performing the way it is.
Left side bar of each block is very similar to OHLC candles except for the following -
Other notes:
Principle:
DXY lies at the heart of the diagram with usd-currency pairs of 5 countries connected to it. When demand for a currency increases it strengthens against Dollar. This is depicted by a line from DXY to the currency indicating demand flow from Dollar to the currency (DXY is only an indicative symbol for Dollar, the currency may not be part of the dollar index). Similarly when Dollar strengthens against the currency, demand flow is depicted by a line from the currency to DXY. Currency blocks are connected to Equity and Bond Yields of the respective countries. Equities and Bonds, when bought, takes the demand from the respective currencies and vice versa.
Overall, the demand flows in the direction of arrows. The flow is incomplete without commodities, import/export, interest/inflation rates of countries, however, the diagram most of the times explains why an asset class is performing the way it is.
Left side bar of each block is very similar to OHLC candles except for the following -
- Instead of wicks, top and bottom of the bar represents high and low for the selected time-frame
- Open and close are normalised for high and low
- Bar border is red if close < prev.close, green if close >= prev.close
Other notes:
- The diagram requires at least 200 bars in the chart to render. Please select the symbol and time-frame that contain at least 200 bars.
- The diagram requires a live market to render the flow. To check flows on historical bars, set the option from settings.
- Desired indices could be selected for countries of choice. Default settings point to futures wherever possible to have the markets live simultaneously across the countries.
オープンソーススクリプト
TradingViewの精神に則り、このスクリプトの作者は、トレーダーが理解し検証できるようにオープンソースで公開しています。作者に敬意を表します!無料で使用することができますが、このコードを投稿で再利用するには、ハウスルールに準拠する必要があります。 お気に入りに登録してチャート上でご利用頂けます。
免責事項
これらの情報および投稿は、TradingViewが提供または保証する金融、投資、取引、またはその他の種類のアドバイスや推奨を意図したものではなく、またそのようなものでもありません。詳しくは利用規約をご覧ください。