OPEN-SOURCE SCRIPT
Recent Swing High/Low Lines With Stats Table
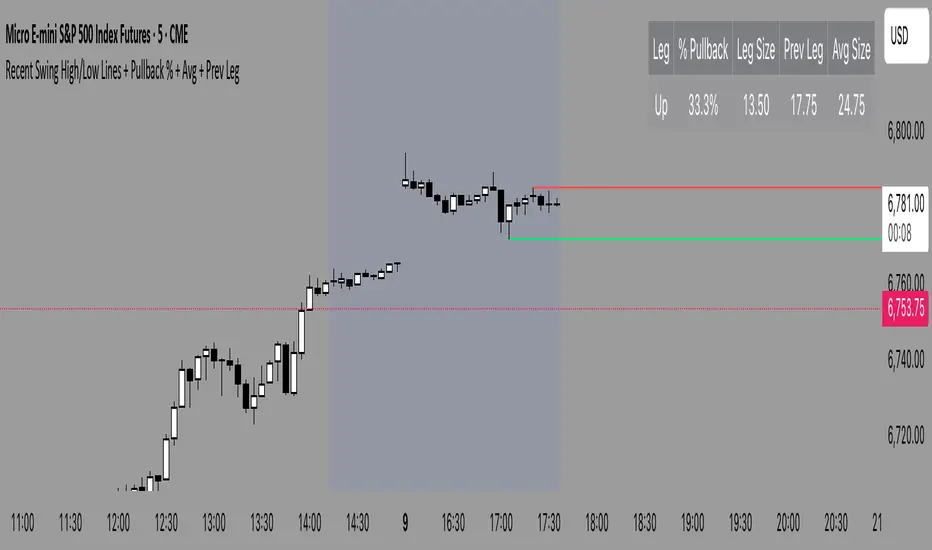
Swing-Based Volatility
This indicator measures volatility using the distance between recent swing highs and swing lows rather than fixed averages like ATR. Each swing captures a meaningful shift in market control, making this a structure-aware view of volatility.
The tool calculates and plots the average swing range over time, highlighting when the market is expanding (wide swings, high volatility) or contracting (tight swings, low volatility). These phases can help traders identify breakout potential, adjust stop-loss or profit targets, and align position sizing with current market conditions.
オープンソーススクリプト
TradingViewの精神に則り、この作者はスクリプトのソースコードを公開しているので、その内容を理解し検証することができます。作者に感謝です!無料でお使いいただけますが、このコードを投稿に再利用する際にはハウスルールに従うものとします。
免責事項
これらの情報および投稿は、TradingViewが提供または保証する金融、投資、取引、またはその他の種類のアドバイスや推奨を意図したものではなく、またそのようなものでもありません。詳しくは利用規約をご覧ください。
オープンソーススクリプト
TradingViewの精神に則り、この作者はスクリプトのソースコードを公開しているので、その内容を理解し検証することができます。作者に感謝です!無料でお使いいただけますが、このコードを投稿に再利用する際にはハウスルールに従うものとします。
免責事項
これらの情報および投稿は、TradingViewが提供または保証する金融、投資、取引、またはその他の種類のアドバイスや推奨を意図したものではなく、またそのようなものでもありません。詳しくは利用規約をご覧ください。