OPEN-SOURCE SCRIPT
Volume vs Price Impact Z-Score
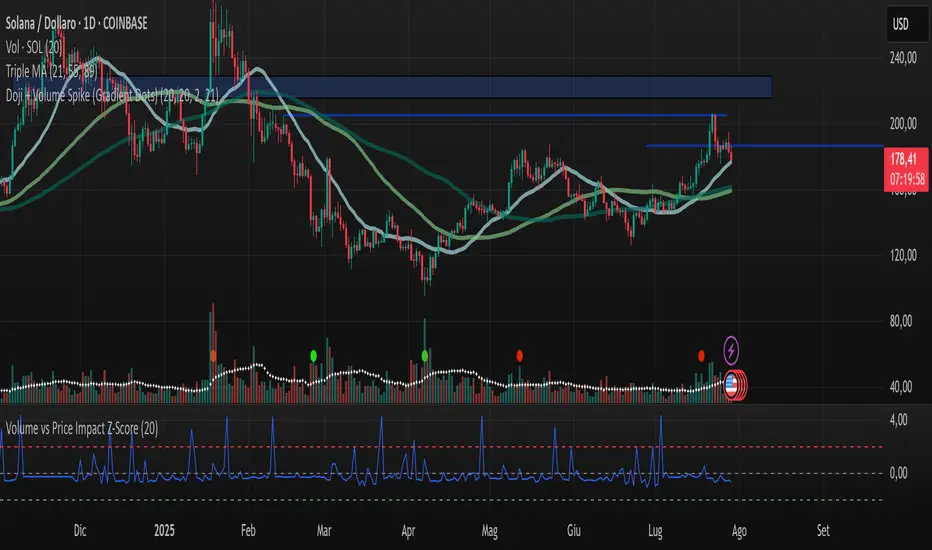
Volume vs Price Impact Z‑Score
This indicator measures how disproportionate the traded volume is relative to the price movement of a candle.
Step 1: Volume-to-Price Impact (VPI)
VPI = Volume / (abs(Close - Open) + ε)
(or optionally using High - Low as the price range)
Step 2: Z‑Score Standardization
Z = (VPI - SMA(VPI, length)) / STDEV(VPI, length)
Interpretation:
Z > 2 → High volume with little price movement → possible absorption (accumulation/distribution).
Z < -2 → Large price move with low volume → weak or illiquid move (potential false breakout).
Use cases:
Detecting accumulation/distribution phases.
Highlighting false breakouts or weak price moves.
Supporting entry/exit decisions based on market efficiency (volume vs. price impact).
オープンソーススクリプト
TradingViewの精神に則り、このスクリプトの作者はコードをオープンソースとして公開してくれました。トレーダーが内容を確認・検証できるようにという配慮です。作者に拍手を送りましょう!無料で利用できますが、コードの再公開はハウスルールに従う必要があります。
免責事項
この情報および投稿は、TradingViewが提供または推奨する金融、投資、トレード、その他のアドバイスや推奨を意図するものではなく、それらを構成するものでもありません。詳細は利用規約をご覧ください。
オープンソーススクリプト
TradingViewの精神に則り、このスクリプトの作者はコードをオープンソースとして公開してくれました。トレーダーが内容を確認・検証できるようにという配慮です。作者に拍手を送りましょう!無料で利用できますが、コードの再公開はハウスルールに従う必要があります。
免責事項
この情報および投稿は、TradingViewが提供または推奨する金融、投資、トレード、その他のアドバイスや推奨を意図するものではなく、それらを構成するものでもありません。詳細は利用規約をご覧ください。