OPEN-SOURCE SCRIPT
Cumulative Volume Delta (CVD)
█ OVERVIEW
Cumulative Volume Delta (CVD) is a volume-based trading indicator that provides a visual representation of market buying and selling pressure by calculating the difference in traded volumes between the two sides. It uses intrabar information to obtain more precise volume delta information than methods using only the chart's timeframe.
Volume delta is the net difference between Buy Volume and Sell Volume. Positive volume delta indicates that buy volume is more than sell volume, and opposite. So Cumulative Volume Delta (CVD) is a running total/cumulation of volume delta values, where positive VD gets added to the sum and negative VD gets subtracted from the sum.
I found simple and fast solution how to calculate CVD, so made plain and concise code, here is CVD function :
Pine Script®
where _c, _o, _v are close, open and volume of intrabar much lower timeframe.
Indicator uses intrabar information to obtain more precise volume delta information than methods using only the chart's timeframe.
Intrabar precision calculation depends on the chart's timeframe:

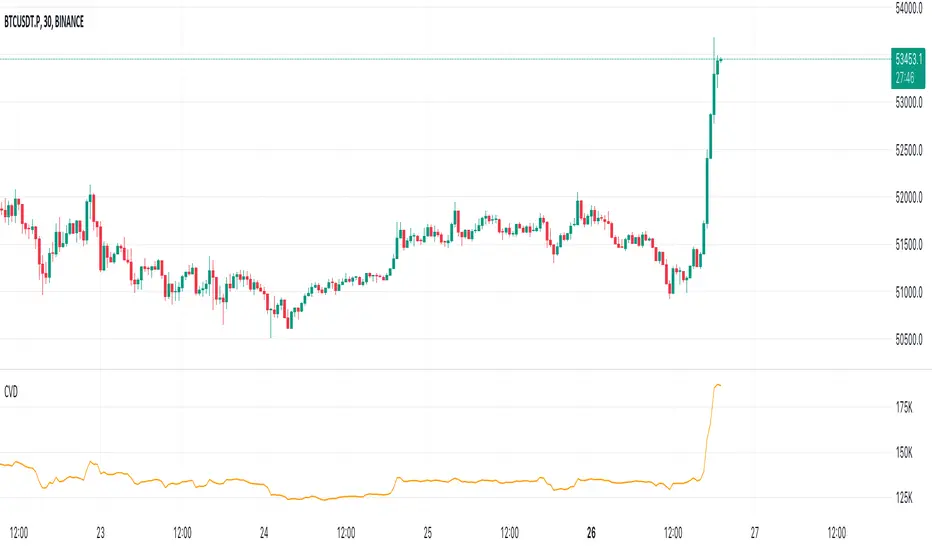
CVD is good to use together with open interest, volume and price change.
For example if CVD is rising and price makes good move up in short period and volume is rising and open interest makes good move up in short period and before was flat market it is show big chance to pump.
Cumulative Volume Delta (CVD) is a volume-based trading indicator that provides a visual representation of market buying and selling pressure by calculating the difference in traded volumes between the two sides. It uses intrabar information to obtain more precise volume delta information than methods using only the chart's timeframe.
Volume delta is the net difference between Buy Volume and Sell Volume. Positive volume delta indicates that buy volume is more than sell volume, and opposite. So Cumulative Volume Delta (CVD) is a running total/cumulation of volume delta values, where positive VD gets added to the sum and negative VD gets subtracted from the sum.
I found simple and fast solution how to calculate CVD, so made plain and concise code, here is CVD function :
cvd(_c, _o, _v) =>
var tcvd = 0.0, delta = 0.0
posV = 0.0, negV = 0.0
totUV = 0.0, totDV = 0.0
switch
_c > _o => posV += _v
_c < _o => negV -= _v
_c > nz(_c[1]) => posV += _v
_c < nz(_c[1]) => negV -= _v
nz(posV[1]) > 0 => posV += _v
nz(negV[1]) < 0 => negV -= _v
totUV += posV
totDV += negV
delta := totUV + totDV
cvd = tcvd + delta
tcvd += delta
cvd
where _c, _o, _v are close, open and volume of intrabar much lower timeframe.
Indicator uses intrabar information to obtain more precise volume delta information than methods using only the chart's timeframe.
Intrabar precision calculation depends on the chart's timeframe:
CVD is good to use together with open interest, volume and price change.
For example if CVD is rising and price makes good move up in short period and volume is rising and open interest makes good move up in short period and before was flat market it is show big chance to pump.
オープンソーススクリプト
TradingViewの精神に則り、このスクリプトの作者はコードをオープンソースとして公開してくれました。トレーダーが内容を確認・検証できるようにという配慮です。作者に拍手を送りましょう!無料で利用できますが、コードの再公開はハウスルールに従う必要があります。
免責事項
この情報および投稿は、TradingViewが提供または推奨する金融、投資、トレード、その他のアドバイスや推奨を意図するものではなく、それらを構成するものでもありません。詳細は利用規約をご覧ください。
オープンソーススクリプト
TradingViewの精神に則り、このスクリプトの作者はコードをオープンソースとして公開してくれました。トレーダーが内容を確認・検証できるようにという配慮です。作者に拍手を送りましょう!無料で利用できますが、コードの再公開はハウスルールに従う必要があります。
免責事項
この情報および投稿は、TradingViewが提供または推奨する金融、投資、トレード、その他のアドバイスや推奨を意図するものではなく、それらを構成するものでもありません。詳細は利用規約をご覧ください。