OPEN-SOURCE SCRIPT
Double Daddy
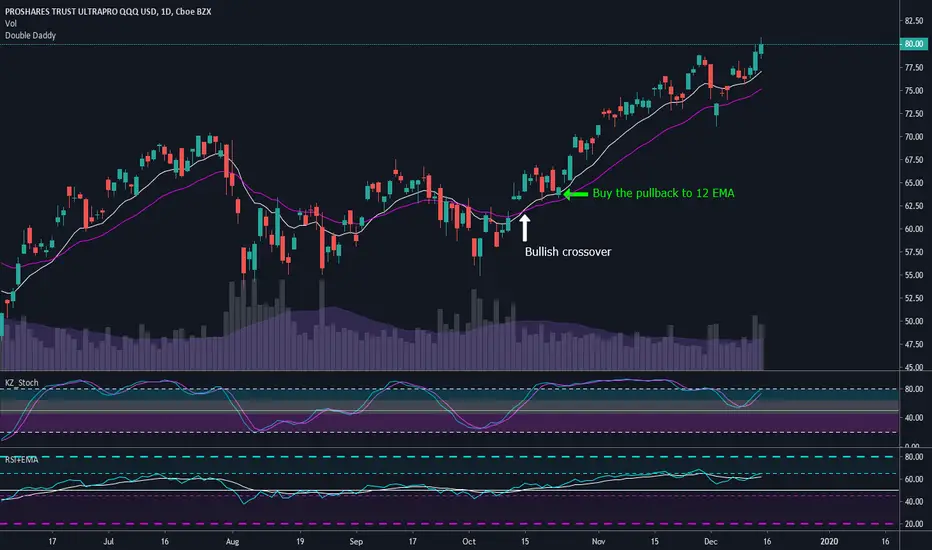
This is a super simple strategy that I use when I miss an entry based on other indicators, or if I've been on a losing streak and I need an easy win. Wait for the 12 EMA to cross above the 26 EMA, and then buy when price pulls back to the 12 or 26 EMA. I prefer to exit my trades based off divergence on the stochastics or RSI, but if you miss that exit then wait for the 12 to cross below the 26 and sell when price to pulls back up to the 12 EMA.
I find this strategy works well on the daily time frame in traditional markets, and for Bitcoin it works well for 6 hour and daily time frames.
Moving averages are lagging indicators so this strategy does not work well in choppy markets or when you have a deep V bottom or blow off top. I only use this strategy when there is a confirmed weekly uptrend.
オープンソーススクリプト
TradingViewの精神に則り、このスクリプトの作者はコードをオープンソースとして公開してくれました。トレーダーが内容を確認・検証できるようにという配慮です。作者に拍手を送りましょう!無料で利用できますが、コードの再公開はハウスルールに従う必要があります。
免責事項
この情報および投稿は、TradingViewが提供または推奨する金融、投資、トレード、その他のアドバイスや推奨を意図するものではなく、それらを構成するものでもありません。詳細は利用規約をご覧ください。
オープンソーススクリプト
TradingViewの精神に則り、このスクリプトの作者はコードをオープンソースとして公開してくれました。トレーダーが内容を確認・検証できるようにという配慮です。作者に拍手を送りましょう!無料で利用できますが、コードの再公開はハウスルールに従う必要があります。
免責事項
この情報および投稿は、TradingViewが提供または推奨する金融、投資、トレード、その他のアドバイスや推奨を意図するものではなく、それらを構成するものでもありません。詳細は利用規約をご覧ください。