OPEN-SOURCE SCRIPT
更新済 Candle Pattern Probability
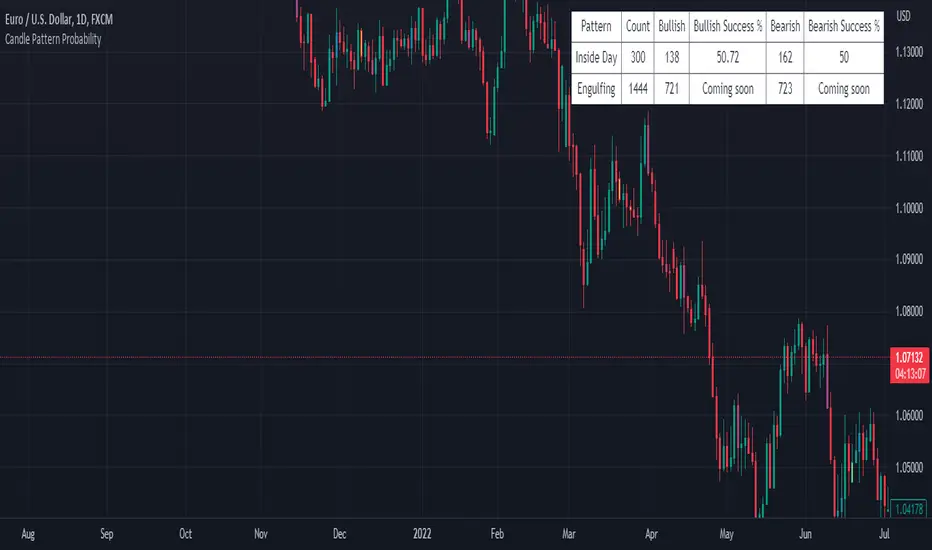
The "Candle Pattern Probability" indicator is a technical analysis tool designed specifically for traders who want to assess the probability of success for different candlestick patterns in the financial markets.
Japanese candlesticks, also known as candlesticks, provide valuable information about price action within a specific time period. These candlestick patterns can help identify potential trend reversals as well as signal entry and exit points in the market.
The "Candle Pattern Probability" indicator uses a data-driven approach to calculate the likelihood of a specific candlestick pattern resulting in a successful price movement. It operates on the premise that certain candlestick patterns tend to repeat and have a higher probability of leading to predictable market movements.
The indicator analyzes a wide variety of candlestick patterns such as the hammer, shooting star, bullish/bearish engulfing, doji, hanging man, among others. It employs specific statistics and algorithms to evaluate the frequency and effectiveness of these patterns in the past, thereby estimating the probability of their repetition in the future.
The indicator's output is visually presented as a percentage value or a color scale, facilitating interpretation by traders. The higher the percentage value or the more intensified the color, the greater the estimated probability of success for the analyzed candlestick pattern.
It is important to note that the "Candle Pattern Probability" indicator is a supplementary tool and should not be considered as a definitive signal for trading decisions. It is recommended to use it in conjunction with other technical indicators, fundamental analysis, and a sound understanding of the market before making trades.
Please remember that the analysis of candlestick patterns and the use of this indicator require practice, experience, and trading knowledge. It is always advisable to conduct additional testing and validation before basing decisions solely on the results provided by this indicator.
リリースノート
Preparing for "Coming soon" changesオープンソーススクリプト
TradingViewの精神に則り、このスクリプトの作者はコードをオープンソースとして公開してくれました。トレーダーが内容を確認・検証できるようにという配慮です。作者に拍手を送りましょう!無料で利用できますが、コードの再公開はハウスルールに従う必要があります。
免責事項
この情報および投稿は、TradingViewが提供または推奨する金融、投資、トレード、その他のアドバイスや推奨を意図するものではなく、それらを構成するものでもありません。詳細は利用規約をご覧ください。
オープンソーススクリプト
TradingViewの精神に則り、このスクリプトの作者はコードをオープンソースとして公開してくれました。トレーダーが内容を確認・検証できるようにという配慮です。作者に拍手を送りましょう!無料で利用できますが、コードの再公開はハウスルールに従う必要があります。
免責事項
この情報および投稿は、TradingViewが提供または推奨する金融、投資、トレード、その他のアドバイスや推奨を意図するものではなく、それらを構成するものでもありません。詳細は利用規約をご覧ください。