OPEN-SOURCE SCRIPT
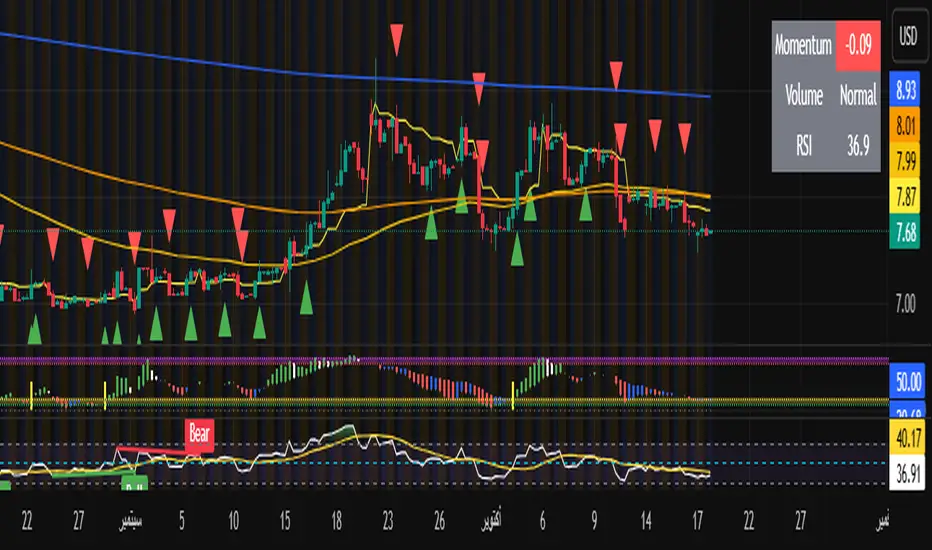
High Momentum Entry
//version=5
indicator("High Momentum Entry", overlay=true)
// Settings
momentum_period = input.int(5, "Momentum Period")
volume_multiplier = input.float(1.3, "Volume Multiplier", minval=1.0, maxval=3.0)
rsi_period = input.int(14, "RSI Period")
// Calculate Momentum
momentum = ta.mom(close, momentum_period)
momentum_ma = ta.sma(momentum, 3)
// Volume Surge
avg_volume = ta.sma(volume, 20)
high_volume = volume > avg_volume * volume_multiplier
// RSI for confirmation
rsi = ta.rsi(close, rsi_period)
// Price Movement
price_rising = close > close[1]
price_falling = close < close[1]
// High Momentum Buy
momentum_positive = momentum > 0
momentum_increasing = momentum > momentum[1]
momentum_strong = momentum > momentum_ma
rsi_good_buy = rsi > 40 and rsi < 70
high_momentum_buy = momentum_positive and momentum_increasing and momentum_strong and high_volume and price_rising and rsi_good_buy
// High Momentum Sell
momentum_negative = momentum < 0
momentum_decreasing = momentum < momentum[1]
momentum_weak = momentum < momentum_ma
rsi_good_sell = rsi > 30 and rsi < 60
high_momentum_sell = momentum_negative and momentum_decreasing and momentum_weak and high_volume and price_falling and rsi_good_sell
// Plot Signals
plotshape(high_momentum_buy, title="Buy Signal", location=location.belowbar, color=color.new(color.green, 0), style=shape.triangleup, size=size.small, text="")
plotshape(high_momentum_sell, title="Sell Signal", location=location.abovebar, color=color.new(color.red, 0), style=shape.triangledown, size=size.small, text="")
// Background for high volume
bgcolor(high_volume ? color.new(color.blue, 95) : na, title="High Volume")
// Simple Info Table
var table info = table.new(position.top_right, 2, 3)
if barstate.islast
table.cell(info, 0, 0, "Momentum", bgcolor=color.gray, text_color=color.white)
mom_color = momentum > 0 ? color.green : color.red
table.cell(info, 1, 0, str.tostring(math.round(momentum, 2)), bgcolor=mom_color, text_color=color.white)
table.cell(info, 0, 1, "Volume", bgcolor=color.gray, text_color=color.white)
vol_color = high_volume ? color.orange : color.gray
table.cell(info, 1, 1, high_volume ? "HIGH" : "Normal", bgcolor=vol_color, text_color=color.white)
table.cell(info, 0, 2, "RSI", bgcolor=color.gray, text_color=color.white)
rsi_color = rsi < 30 ? color.green : rsi > 70 ? color.red : color.gray
table.cell(info, 1, 2, str.tostring(math.round(rsi, 1)), bgcolor=rsi_color, text_color=color.white)
// Alerts
alertcondition(high_momentum_buy, "High Momentum Entry", "Strong Bullish Momentum")
alertcondition(high_momentum_sell, "High Momentum Exit", "Strong Bearish Momentum")
オープンソーススクリプト
TradingViewの精神に則り、この作者はスクリプトのソースコードを公開しているので、その内容を理解し検証することができます。作者に感謝です!無料でお使いいただけますが、このコードを投稿に再利用する際にはハウスルールに従うものとします。
免責事項
これらの情報および投稿は、TradingViewが提供または保証する金融、投資、取引、またはその他の種類のアドバイスや推奨を意図したものではなく、またそのようなものでもありません。詳しくは利用規約をご覧ください。
オープンソーススクリプト
TradingViewの精神に則り、この作者はスクリプトのソースコードを公開しているので、その内容を理解し検証することができます。作者に感謝です!無料でお使いいただけますが、このコードを投稿に再利用する際にはハウスルールに従うものとします。
免責事項
これらの情報および投稿は、TradingViewが提供または保証する金融、投資、取引、またはその他の種類のアドバイスや推奨を意図したものではなく、またそのようなものでもありません。詳しくは利用規約をご覧ください。