OPEN-SOURCE SCRIPT
更新済 R-I-ORB
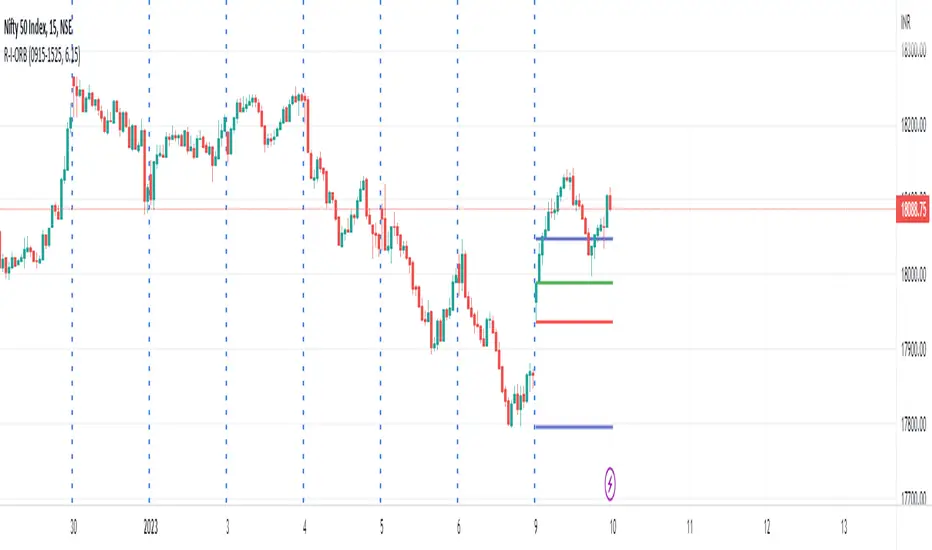
This is an intraday indicator which plots high and low of timeframe's first bar.
Top line - High of the first session bar
Bottom line - low of the first session bar
Requires session timing and total trading hours to plot the lines appropriately.
We can use the indicator to trade intraday opening range breakouts.
Thanks!
Top line - High of the first session bar
Bottom line - low of the first session bar
Requires session timing and total trading hours to plot the lines appropriately.
We can use the indicator to trade intraday opening range breakouts.
Thanks!
リリースノート
Update : Color customization by userリリースノート
Added new lines,PDH - Previous Day High
PDL - Previous Day Low
Plot Historical lines - Plot ORB, PDH & PDL lines to historical data. This setting is turned off by default. It can be turned on if we need to plot lines on historical bars.
Colors can be changed for PDH & PDL values.
リリースノート
Risk Disclosure: This indicator does not provide buy/sell signals and relies on past data, which may not accurately reflect future outcomes. We are not liable for any profits or losses incurred. Please assess and trade at your own risk.オープンソーススクリプト
TradingViewの精神に則り、このスクリプトの作者はコードをオープンソースとして公開してくれました。トレーダーが内容を確認・検証できるようにという配慮です。作者に拍手を送りましょう!無料で利用できますが、コードの再公開はハウスルールに従う必要があります。
免責事項
この情報および投稿は、TradingViewが提供または推奨する金融、投資、トレード、その他のアドバイスや推奨を意図するものではなく、それらを構成するものでもありません。詳細は利用規約をご覧ください。
オープンソーススクリプト
TradingViewの精神に則り、このスクリプトの作者はコードをオープンソースとして公開してくれました。トレーダーが内容を確認・検証できるようにという配慮です。作者に拍手を送りましょう!無料で利用できますが、コードの再公開はハウスルールに従う必要があります。
免責事項
この情報および投稿は、TradingViewが提供または推奨する金融、投資、トレード、その他のアドバイスや推奨を意図するものではなく、それらを構成するものでもありません。詳細は利用規約をご覧ください。