OPEN-SOURCE SCRIPT
Biotech Volume Oscillator
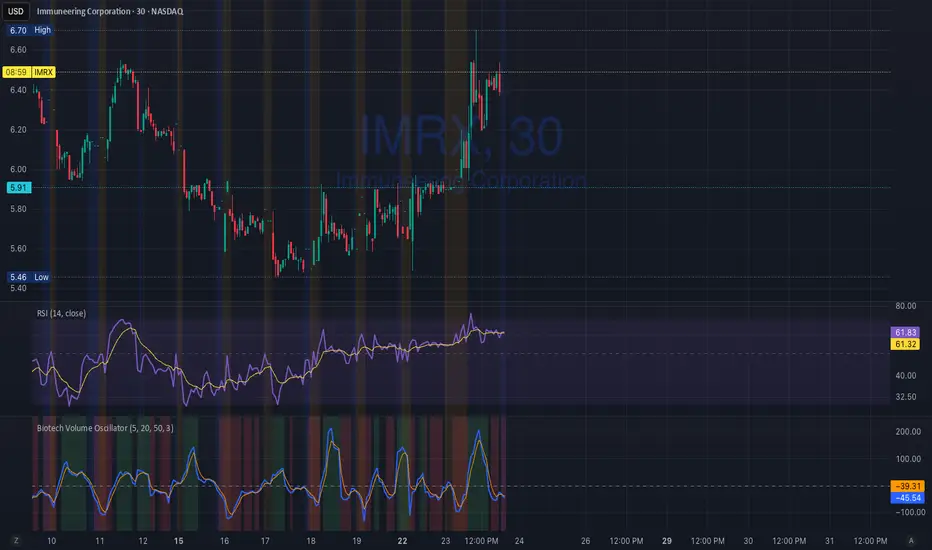
1️⃣ What This Indicator Is (In One Sentence)
It tells you whether people are actually showing up to trade the stock, or if price is just drifting around on low interest.
That’s it.
It does not predict price.
It tells you whether a move is real or fragile.
2️⃣ What the Lines Mean
You see two lines:
🔵 Blue Line = Live Participation
Fast
Reacts immediately
Shows what traders are doing right now
Think:
“Is anyone actually trading this candle?”
🟠 Orange Line = Accepted Participation
Slower
Smoothed
Shows what the market has decided is normal
Think:
“Is this level of activity sticking?”
3️⃣ What the Numbers Mean (Very Important)
The numbers are percentages vs normal volume for this stock.
Around 0
Volume is normal
Nothing special happening
+10 to +25
Healthy interest
Traders are paying attention
Moves can continue
Above +25
Abnormal participation
News, hype, or institutions involved
Moves here tend to be fast
Below –20
Participation drying up
Drift, chop, fake breakouts
Below –30
Nobody is home
Price can move, but it’s fragile
Breakouts usually fail
4️⃣ How to Use It (Step-by-Step)
Step 1: Ignore Price for a Second
Look only at the oscillator.
Ask:
“Is this above zero or below zero?”
Step 2: Look at Direction
Rising oscillator → interest increasing
Falling oscillator → interest fading
Step 3: Compare Blue vs Orange
✅ Good / Healthy
Blue above orange
Both rising
→ New participation is entering
⚠️ Warning
Price rising
Blue flat or falling
Orange flat
→ Float, not conviction
🚨 Distribution
Blue rolls over from high levels
Orange follows
Price still looks “fine”
→ Selling into strength
オープンソーススクリプト
TradingViewの精神に則り、このスクリプトの作者はコードをオープンソースとして公開してくれました。トレーダーが内容を確認・検証できるようにという配慮です。作者に拍手を送りましょう!無料で利用できますが、コードの再公開はハウスルールに従う必要があります。
免責事項
この情報および投稿は、TradingViewが提供または推奨する金融、投資、トレード、その他のアドバイスや推奨を意図するものではなく、それらを構成するものでもありません。詳細は利用規約をご覧ください。
オープンソーススクリプト
TradingViewの精神に則り、このスクリプトの作者はコードをオープンソースとして公開してくれました。トレーダーが内容を確認・検証できるようにという配慮です。作者に拍手を送りましょう!無料で利用できますが、コードの再公開はハウスルールに従う必要があります。
免責事項
この情報および投稿は、TradingViewが提供または推奨する金融、投資、トレード、その他のアドバイスや推奨を意図するものではなく、それらを構成するものでもありません。詳細は利用規約をご覧ください。