OPEN-SOURCE SCRIPT
Plaid Stochastic / RSI Triple Combo Indicator [sclark39]
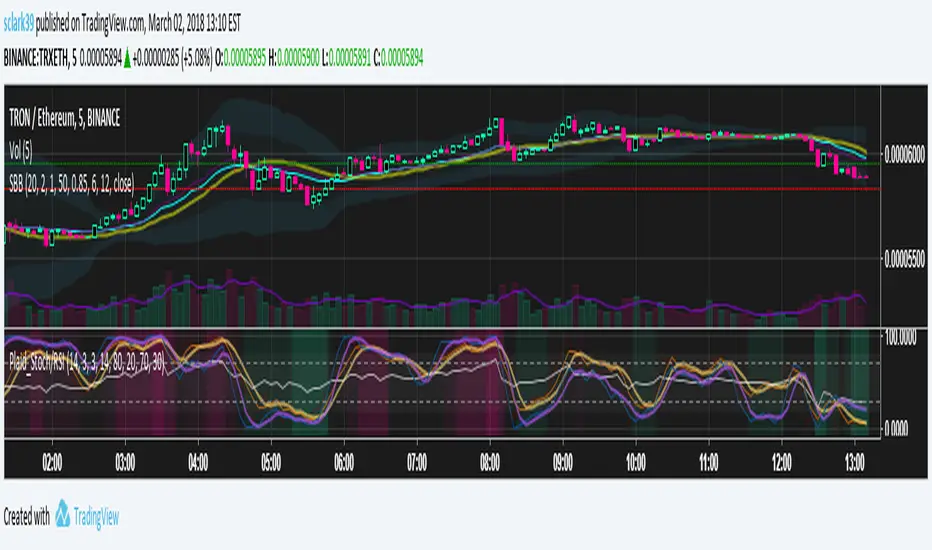
Welcome to my "Plaid" Stochastic / RSI / StochRSI Combo indicator.
This shows the Fast and Slow Stochastic (orange and yellow), Relative Strength Index (white), and the Stochastic RSI (purple). As the lines cross the 80/20 and 70/30 lines, the background color changes to make it easy to see at a glance how many of the indicators have crossed their threshold. In the options you can change the period lengths and hide/show each of type of indicator to best fit your trading style.
Use this indicator for trades at your own risk, I made this for fun and it is not a trade recommendation.
That being said, if you like my work please tip me!
ETH: 0xf8E0Ea503B5c833fD4546E7fa2c70EcE42A27C8A
Please comment with feedback and requests!
オープンソーススクリプト
TradingViewの精神に則り、このスクリプトの作者はコードをオープンソースとして公開してくれました。トレーダーが内容を確認・検証できるようにという配慮です。作者に拍手を送りましょう!無料で利用できますが、コードの再公開はハウスルールに従う必要があります。
免責事項
この情報および投稿は、TradingViewが提供または推奨する金融、投資、トレード、その他のアドバイスや推奨を意図するものではなく、それらを構成するものでもありません。詳細は利用規約をご覧ください。
オープンソーススクリプト
TradingViewの精神に則り、このスクリプトの作者はコードをオープンソースとして公開してくれました。トレーダーが内容を確認・検証できるようにという配慮です。作者に拍手を送りましょう!無料で利用できますが、コードの再公開はハウスルールに従う必要があります。
免責事項
この情報および投稿は、TradingViewが提供または推奨する金融、投資、トレード、その他のアドバイスや推奨を意図するものではなく、それらを構成するものでもありません。詳細は利用規約をご覧ください。