OPEN-SOURCE SCRIPT
更新済 Classic_Levels
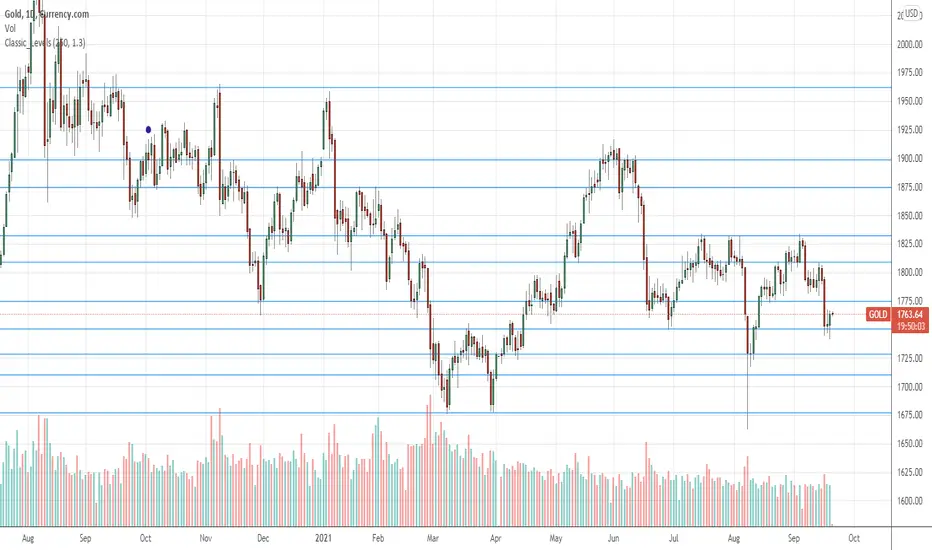
Displays horizontal lines that represent support and resistance levels.
You can use it with any symbol and on any timeframe.
Parameter 'Time range' means number of candles in consideration. The beginning of the range is marked with a little violet circle.
The more 'Sensitivity' is, the more levels are displayed.
You can use it with any symbol and on any timeframe.
Parameter 'Time range' means number of candles in consideration. The beginning of the range is marked with a little violet circle.
The more 'Sensitivity' is, the more levels are displayed.
リリースノート
Little changes in comments and variable names.リリースノート
Some internal coefficients changed.リリースノート
***リリースノート
Little corrections to the algorithm.リリースノート
Increased performance.リリースノート
Function was removed.リリースノート
Array used.リリースノート
Algorithm slightly changed, performance improved.オープンソーススクリプト
TradingViewの精神に則り、このスクリプトの作者はコードをオープンソースとして公開してくれました。トレーダーが内容を確認・検証できるようにという配慮です。作者に拍手を送りましょう!無料で利用できますが、コードの再公開はハウスルールに従う必要があります。
免責事項
この情報および投稿は、TradingViewが提供または推奨する金融、投資、トレード、その他のアドバイスや推奨を意図するものではなく、それらを構成するものでもありません。詳細は利用規約をご覧ください。
オープンソーススクリプト
TradingViewの精神に則り、このスクリプトの作者はコードをオープンソースとして公開してくれました。トレーダーが内容を確認・検証できるようにという配慮です。作者に拍手を送りましょう!無料で利用できますが、コードの再公開はハウスルールに従う必要があります。
免責事項
この情報および投稿は、TradingViewが提供または推奨する金融、投資、トレード、その他のアドバイスや推奨を意図するものではなく、それらを構成するものでもありません。詳細は利用規約をご覧ください。