OPEN-SOURCE SCRIPT
更新済 OBV Overbuy+sell by RSU
On-balance volume (OBV) is a technical trading momentum indicator that uses volume flow to predict changes in stock price. Joseph Granville first developed the OBV metric in the 1963 book Granville's New Key to Stock Market Profits.
This indicator is based on the OBV indicator and adds 2 times the standard deviation Bollinger Band to evaluate the overbought and oversold phenomenon of the OBV indicator.
The characteristics of Bollinger Bands: According to the normal distribution phenomenon, only 5% of the cases will exceed 2 times the standard deviation of the Bollinger Bands. So when it exceeds, I will use colors to mark red overbought and green oversold situations.
Usage:
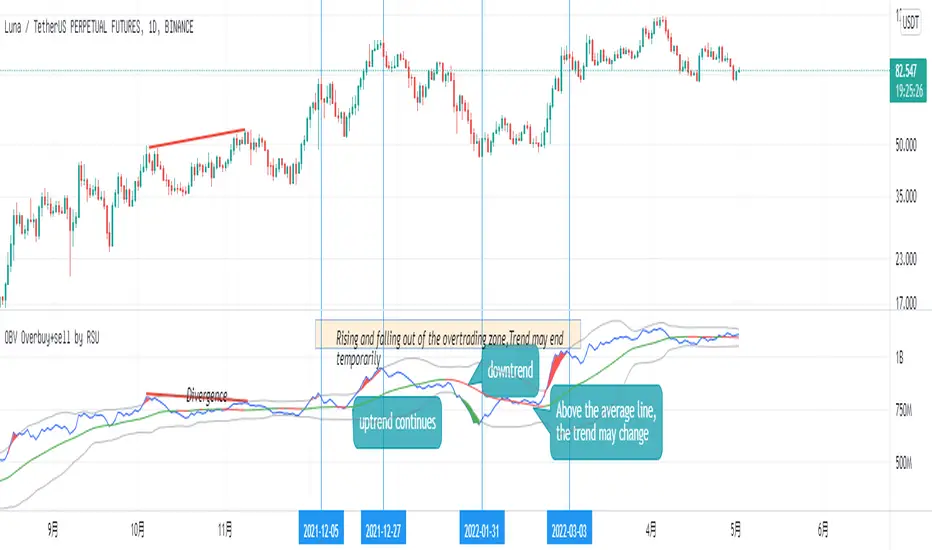
1.Identify trends: Identify current stock trends by OBV's 30 average line color.
2.Breakthrough:A break below overbuy could signal a temporary end to the uptrend.
3.Oversell and overbuy:A break below overbuy could signal a temporary end to the uptrend.
4.Divergence:When the slope of the two highs is opposite to the slope of the two highs of the indicator, a trend reversal signal may occur.
This indicator is based on the OBV indicator and adds 2 times the standard deviation Bollinger Band to evaluate the overbought and oversold phenomenon of the OBV indicator.
The characteristics of Bollinger Bands: According to the normal distribution phenomenon, only 5% of the cases will exceed 2 times the standard deviation of the Bollinger Bands. So when it exceeds, I will use colors to mark red overbought and green oversold situations.
Usage:
1.Identify trends: Identify current stock trends by OBV's 30 average line color.
2.Breakthrough:A break below overbuy could signal a temporary end to the uptrend.
3.Oversell and overbuy:A break below overbuy could signal a temporary end to the uptrend.
4.Divergence:When the slope of the two highs is opposite to the slope of the two highs of the indicator, a trend reversal signal may occur.
リリースノート
change:Added smoothing parameter to reduce sawtooth.
Usage:
1.Identify trends: Identify current stock trends by OBV's 30 average line color.
2.Breakthrough:OBV Breakthrough 30 average,signal trend may reversal.
3.Oversell and overbuy:A break below overbuy could signal a temporary end to the uptrend.
4.Divergence:When the slope of the two highs is opposite to the slope of the two highs of the indicator, a trend reversal signal may occur.
リリースノート
changes:Added 1x Bollinger Bands display, updated colors.オープンソーススクリプト
TradingViewの精神に則り、このスクリプトの作者はコードをオープンソースとして公開してくれました。トレーダーが内容を確認・検証できるようにという配慮です。作者に拍手を送りましょう!無料で利用できますが、コードの再公開はハウスルールに従う必要があります。
免責事項
この情報および投稿は、TradingViewが提供または推奨する金融、投資、トレード、その他のアドバイスや推奨を意図するものではなく、それらを構成するものでもありません。詳細は利用規約をご覧ください。
オープンソーススクリプト
TradingViewの精神に則り、このスクリプトの作者はコードをオープンソースとして公開してくれました。トレーダーが内容を確認・検証できるようにという配慮です。作者に拍手を送りましょう!無料で利用できますが、コードの再公開はハウスルールに従う必要があります。
免責事項
この情報および投稿は、TradingViewが提供または推奨する金融、投資、トレード、その他のアドバイスや推奨を意図するものではなく、それらを構成するものでもありません。詳細は利用規約をご覧ください。