OPEN-SOURCE SCRIPT
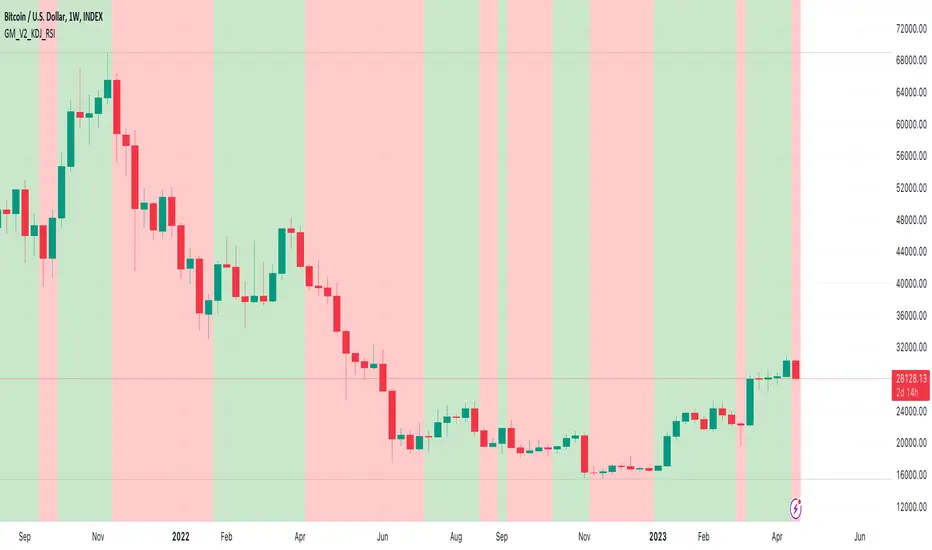
KDJ Indicator with RSI Filter

The KDJ indicator is a technical analysis tool used by traders to identify potential buy and sell signals in financial markets. It is an extension of the Stochastic Oscillator, which consists of two lines, %K and %D, that move within a range of 0 to 100. The KDJ indicator introduces a third line, called %J, which is derived from the %K and %D lines. The KDJ indicator is primarily used to identify overbought and oversold conditions, as well as potential trend reversals.
Here's a brief overview of the KDJ indicator's components:
%K line: It is calculated by comparing the current closing price to the range of high and low prices over a specific period (usually 9 days).
%D line: It is a moving average of the %K line
%J line: It is calculated using the %K and %D lines
The KDJ indicator generates buy signals when the %K line crosses above the %D line and sell signals when the %K line crosses below the %D line. Additionally, when the %J line is above 100, it suggests that the asset is overbought, and when the %J line is below 0, it suggests that the asset is oversold. Traders often use these overbought and oversold signals to identify potential trend reversals.
I have taken KDJ script from and added RSI filter and alerts with and without RSI filter.
I was requested to create this script with alerts. And here it is. I have added alerts. And, I have added abilities to turn on and off the RSI filters from settings.
Here's a brief overview of the KDJ indicator's components:
%K line: It is calculated by comparing the current closing price to the range of high and low prices over a specific period (usually 9 days).
%D line: It is a moving average of the %K line
%J line: It is calculated using the %K and %D lines
The KDJ indicator generates buy signals when the %K line crosses above the %D line and sell signals when the %K line crosses below the %D line. Additionally, when the %J line is above 100, it suggests that the asset is overbought, and when the %J line is below 0, it suggests that the asset is oversold. Traders often use these overbought and oversold signals to identify potential trend reversals.
I have taken KDJ script from

I was requested to create this script with alerts. And here it is. I have added alerts. And, I have added abilities to turn on and off the RSI filters from settings.
オープンソーススクリプト
TradingViewの精神に則り、このスクリプトの作者はコードをオープンソースとして公開してくれました。トレーダーが内容を確認・検証できるようにという配慮です。作者に拍手を送りましょう!無料で利用できますが、コードの再公開はハウスルールに従う必要があります。
For guides on how to use the Aladdin indicator or how to buy it, please check joy-bangla.gitbook.io/aladdin/
免責事項
この情報および投稿は、TradingViewが提供または推奨する金融、投資、トレード、その他のアドバイスや推奨を意図するものではなく、それらを構成するものでもありません。詳細は利用規約をご覧ください。