OPEN-SOURCE SCRIPT
Trend Intensity
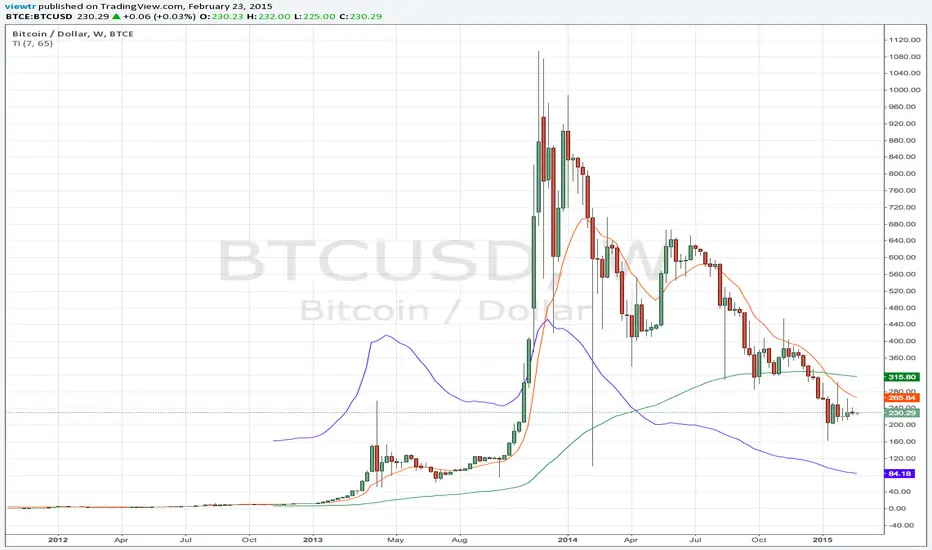
The Trend Intensity indicator measures the strength of the trend. Trend intensity tells us whether we are in an up or downtrend.
Ex:
A TI value of 150 means that the 7 day moving average is currently 50% above the 65 day moving average. This tells us that prices were moving up quickly in recent history.
A TI value of 80 tells us that the 7 day moving average is currently 20% below the 65 day moving average. This tells us that prices were moving down in recent history.
オープンソーススクリプト
TradingViewの精神に則り、このスクリプトの作者はコードをオープンソースとして公開してくれました。トレーダーが内容を確認・検証できるようにという配慮です。作者に拍手を送りましょう!無料で利用できますが、コードの再公開はハウスルールに従う必要があります。
免責事項
この情報および投稿は、TradingViewが提供または推奨する金融、投資、トレード、その他のアドバイスや推奨を意図するものではなく、それらを構成するものでもありません。詳細は利用規約をご覧ください。
オープンソーススクリプト
TradingViewの精神に則り、このスクリプトの作者はコードをオープンソースとして公開してくれました。トレーダーが内容を確認・検証できるようにという配慮です。作者に拍手を送りましょう!無料で利用できますが、コードの再公開はハウスルールに従う必要があります。
免責事項
この情報および投稿は、TradingViewが提供または推奨する金融、投資、トレード、その他のアドバイスや推奨を意図するものではなく、それらを構成するものでもありません。詳細は利用規約をご覧ください。