OPEN-SOURCE SCRIPT
更新済 5m Candle Overlay
Description:
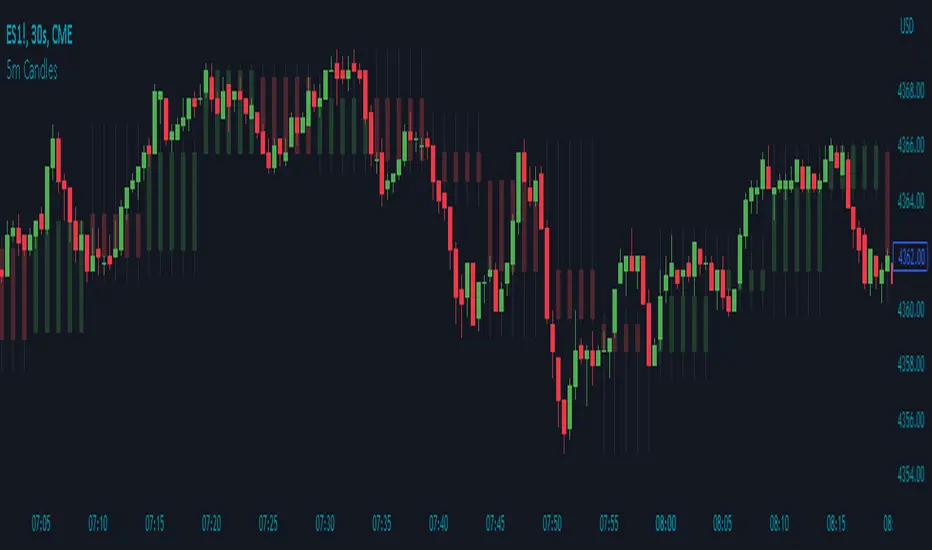
The 5m Candle Overlay indicator is a powerful technical analysis tool designed to overlay 5-minute candles onto your chart. This indicator enables detailed analysis of price action within the 5-minute time frame, providing valuable insights into short-term market movements.
How it Works:
The 5m Candle Overlay indicator calculates the OHLC (Open, High, Low, Close) values specifically for the 5-minute time frame. By utilizing the request.security function, it retrieves the OHLC values for each 5-minute candle. The indicator then determines the color for each candle based on a comparison between the close and open prices. Bullish candles are assigned a green color with 75% opacity, while bearish candles are assigned a red color with 75% opacity. Additionally, the indicator checks if the current bar index is a multiple of 5 to prevent overlapping and enhance visualization.
Usage:
To effectively utilize the 5m Candle Overlay indicator, follow these steps:
1. Apply the 5m Candle Overlay indicator to your chart by adding it from the available indicators.
2. Observe the overlay of 5-minute candles on your chart, providing a detailed representation of price movements within the 5-minute time frame.
3. Interpret the candles:
- Bullish candles (green by default) indicate that the close price is higher than the open price, suggesting potential buying pressure.
- Bearish candles (red by default) indicate that the close price is lower than the open price, suggesting potential selling pressure.
4. Note that the indicator plots candles with a vertical offset every fifth indicator to prevent overlapping, ensuring clarity and ease of interpretation.
5. Combine the analysis of the 5-minute candles with other technical analysis tools, such as support and resistance levels, trend lines, or indicators from different time frames, to gain deeper insights and identify potential trade setups.
6. Implement appropriate risk management strategies, including setting stop-loss orders and position sizing, to effectively manage your trades within the 5-minute time frame and protect your capital.
リリースノート
Update to indicator image.リリースノート
Updates to the color settingsオープンソーススクリプト
TradingViewの精神に則り、このスクリプトの作者はコードをオープンソースとして公開してくれました。トレーダーが内容を確認・検証できるようにという配慮です。作者に拍手を送りましょう!無料で利用できますが、コードの再公開はハウスルールに従う必要があります。
免責事項
この情報および投稿は、TradingViewが提供または推奨する金融、投資、トレード、その他のアドバイスや推奨を意図するものではなく、それらを構成するものでもありません。詳細は利用規約をご覧ください。
オープンソーススクリプト
TradingViewの精神に則り、このスクリプトの作者はコードをオープンソースとして公開してくれました。トレーダーが内容を確認・検証できるようにという配慮です。作者に拍手を送りましょう!無料で利用できますが、コードの再公開はハウスルールに従う必要があります。
免責事項
この情報および投稿は、TradingViewが提供または推奨する金融、投資、トレード、その他のアドバイスや推奨を意図するものではなく、それらを構成するものでもありません。詳細は利用規約をご覧ください。