OPEN-SOURCE SCRIPT
volatility-weighted price change divergence
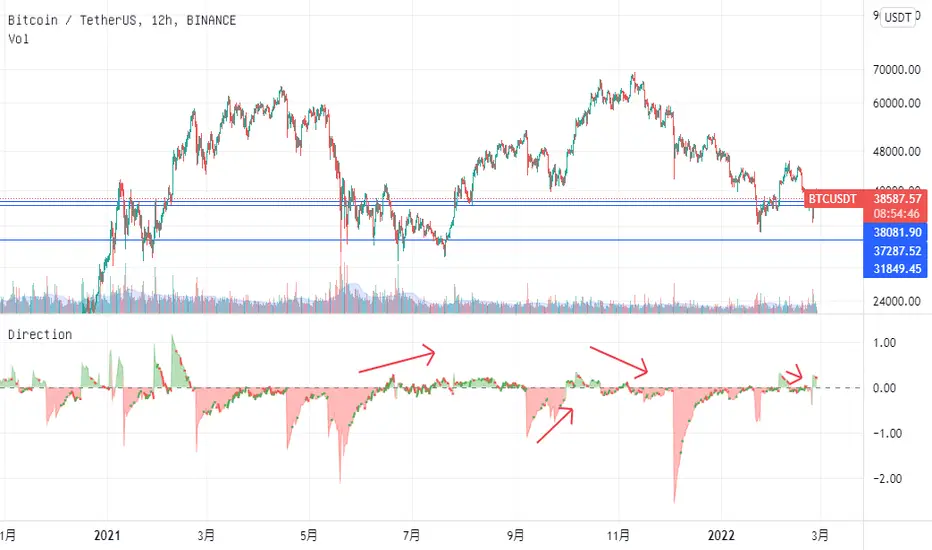
EMA of intrabar-volatility-weighted price change minus EMA of price change. It puts more weights on candles that have large volatility inside, and assumes that the direction of those high-volatility candles are more meaningful than low-volatility ones. Therefore, we take the difference between the volatility-weighted price change and the regular price change and plot the EMA. The indicator may be used as a tool to find divergence and potential reversal, or hints of continuation of a strong trend. Note that this indicator can change a lot with different time frames and settings, so take care to backtest before using. Recommended settings are 15m resolution for time frames longer than 4H and 1m resolution (with 200 EMA length) for time frames below 4H. The resolution is used to find the intrabar volatility.
オープンソーススクリプト
TradingViewの精神に則り、このスクリプトの作者はコードをオープンソースとして公開してくれました。トレーダーが内容を確認・検証できるようにという配慮です。作者に拍手を送りましょう!無料で利用できますが、コードの再公開はハウスルールに従う必要があります。
免責事項
この情報および投稿は、TradingViewが提供または推奨する金融、投資、トレード、その他のアドバイスや推奨を意図するものではなく、それらを構成するものでもありません。詳細は利用規約をご覧ください。
オープンソーススクリプト
TradingViewの精神に則り、このスクリプトの作者はコードをオープンソースとして公開してくれました。トレーダーが内容を確認・検証できるようにという配慮です。作者に拍手を送りましょう!無料で利用できますが、コードの再公開はハウスルールに従う必要があります。
免責事項
この情報および投稿は、TradingViewが提供または推奨する金融、投資、トレード、その他のアドバイスや推奨を意図するものではなく、それらを構成するものでもありません。詳細は利用規約をご覧ください。