OPEN-SOURCE SCRIPT
更新済 Every single moving average (ALMA, EMA, HMA, KAMA, RMA, SMA...)

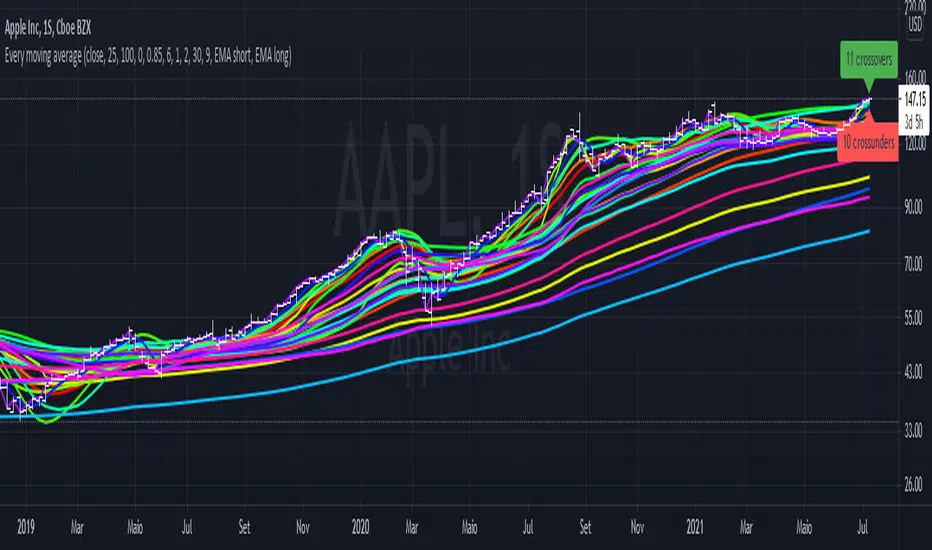
So you may be looking at the graph and thinking "this is a mess", and I agree.
The purpose of this script is to plot in the same graph every single type of moving average that I could think of, so you can find the ones that are better for your timeframe and for your asset. Once you add it, disable those types that doesn't seem to serve your purpose, until you can select one you like.
The average types are: ALMA, EMA, HMA, KAMA, RMA, SMA, SWMA, VIDYA, VWAP, VWMA, and WMA. Each one is ploted two times (except SWMA and VWAP), one with a short period, and another with a long, both of which you can configure.
リリースノート
Added an option to view where crossovers and crossunders happened. You need to select which MA type you want.リリースノート
Fixed typo.リリースノート
Yet another typo.リリースノート
Ok this the last one I swearリリースノート
Included FRAMA and made VIDYA actually working.リリースノート
I made the adaptive MAs better at the beginning by using the start price instead of 0. You can also see how many crossovers and crossunders happened, and noew you can easily disable short and long MAs. I also generated new colors so now it looks even more like a unicorn's puke.リリースノート
Included DEMA and LSMA. Also added an option to offset every average.リリースノート
I made use of the new inline and group features on the input functions, so now they should be clearer and better organized.リリースノート
I made some changes to the code to make it more readable.リリースノート
Oops, wrong graph.オープンソーススクリプト
TradingViewの精神に則り、このスクリプトの作者はコードをオープンソースとして公開してくれました。トレーダーが内容を確認・検証できるようにという配慮です。作者に拍手を送りましょう!無料で利用できますが、コードの再公開はハウスルールに従う必要があります。
免責事項
この情報および投稿は、TradingViewが提供または推奨する金融、投資、トレード、その他のアドバイスや推奨を意図するものではなく、それらを構成するものでもありません。詳細は利用規約をご覧ください。
オープンソーススクリプト
TradingViewの精神に則り、このスクリプトの作者はコードをオープンソースとして公開してくれました。トレーダーが内容を確認・検証できるようにという配慮です。作者に拍手を送りましょう!無料で利用できますが、コードの再公開はハウスルールに従う必要があります。
免責事項
この情報および投稿は、TradingViewが提供または推奨する金融、投資、トレード、その他のアドバイスや推奨を意図するものではなく、それらを構成するものでもありません。詳細は利用規約をご覧ください。