OPEN-SOURCE SCRIPT
Trend Score with Dynamic Stop Loss RTH
📘 Trend Score with Dynamic Stop Loss (RTH) — Guide
🔎 Overview
This indicator tracks intraday momentum during Regular Trading Hours and flags trend flips using a cumulative TrendScore. It also draws dynamic stop-loss levels and shows a live stats table for quick decision-making and journaling.
⸻
⚙️ Core Concepts
1) TrendScore (per bar)
• +1 if the current bar makes a higher high than the previous bar (counted once per bar).
• –1 if the current bar makes a lower low than the previous bar (counted once per bar).
• If a bar takes both the prior high and low, the net contribution can cancel out within that bar.
2) Cumulative TrendScore (running total)
• The per-bar TrendScore accumulates across the session to form the cumulative TrendScore (TS).
• TS resets to 0 at session open and is cleared at session close.
• Rising TS = persistent upside pressure; falling TS = persistent downside pressure.
⸻
🔄 Flip Rules (3-point reversal of the cumulative TrendScore)
A flip occurs when the cumulative TrendScore reverses by 3 points in the opposite direction of the current trend.
• Bullish Flip
• Trigger: After a decline, the cumulative TrendScore rises by +3 from its down-leg.
• Interpretation: Bulls have taken control.
• Stop-loss: the lowest price of the prior (down) leg.
• Bearish Flip
• Trigger: After a rise, the cumulative TrendScore falls by –3 from its up-leg.
• Interpretation: Bears have taken control.
• Stop-loss: the highest price of the prior (up) leg.
Flip bars are marked with ▲ (lime) for bullish and ▼ (red) for bearish.
Note: If you prefer a different reversal distance, adjust the flip distance setting in the script’s inputs (default is 3).
⸻
📏 Stop-Loss Lines
• A dotted line is drawn at the prior leg’s extreme:
Green (below price) after a bullish flip.
Red (above price) after a bearish flip.
• Options:
Remove on touch for a clean chart.
Freeze on touch to keep a visual record for journaling.
• All stop lines are cleared at session end.
⸻
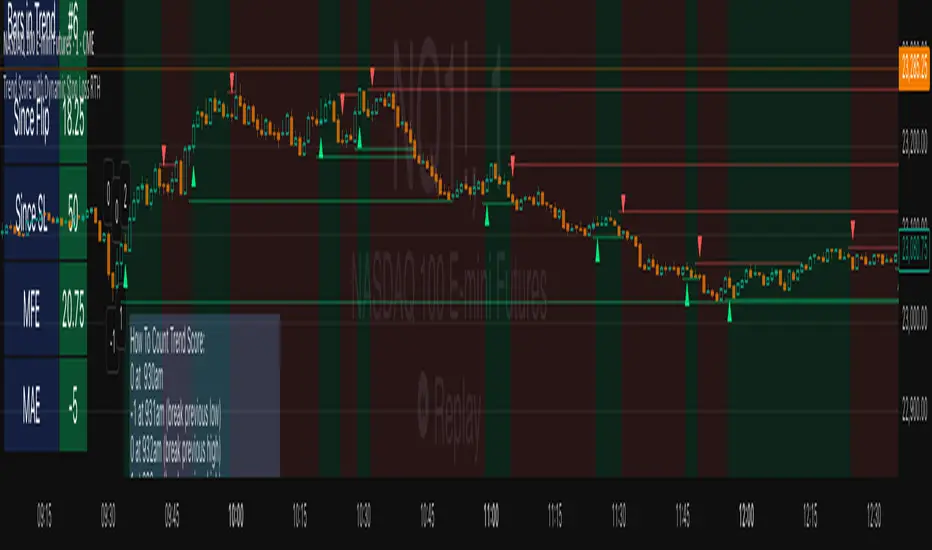
🧮 Stats Table (what you see)
• Trend: Bull / Bear / Neutral
• Bars in Trend: Count since the flip bar
• Since Flip: Current close minus flip bar close
• Since SL: Current close minus active stop level
• MFE-Maximum Favorable Excursion: Highest favorable move since flip
• MAE-Maximum Adverse Excursion: Largest adverse move since flip
Table colors reflect the current trend (green for bull, red for bear).
⸻
📊 Trading Playbook
Entries
• Aggressive: Enter immediately on a flip marker.
• Conservative: Wait for a small pullback that doesn’t violate the stop.
Stops
• Place the stop at the script’s flip stop-loss line (the prior leg extreme).
Exits
Choose one style and stick with it:
• Stop-only: Exit when the stop is hit.
• Time-based: Flatten at session close.
• Targets: Scale/close at 1R, 2R.
• Trailing: Trail behind minor swings once MFE > 1R.
Ultimately Exit choice is your own edge, so you must decide for yourself.
💡 Best Practices
• Skip the first few bars after the open (gap noise).
• Use regular candles (Heikin-Ashi will distort highs/lows).
• If you want fewer flips, increase the flip distance (e.g., 4 or 5). For more
responsiveness, use 2. Otherwise, increase your time frame to 5m, 10m, 15m.
• Keep SL lines frozen (not auto-removed) if you’re journaling.
オープンソーススクリプト
TradingViewの精神に則り、このスクリプトの作者はコードをオープンソースとして公開してくれました。トレーダーが内容を確認・検証できるようにという配慮です。作者に拍手を送りましょう!無料で利用できますが、コードの再公開はハウスルールに従う必要があります。
免責事項
この情報および投稿は、TradingViewが提供または推奨する金融、投資、トレード、その他のアドバイスや推奨を意図するものではなく、それらを構成するものでもありません。詳細は利用規約をご覧ください。
オープンソーススクリプト
TradingViewの精神に則り、このスクリプトの作者はコードをオープンソースとして公開してくれました。トレーダーが内容を確認・検証できるようにという配慮です。作者に拍手を送りましょう!無料で利用できますが、コードの再公開はハウスルールに従う必要があります。
免責事項
この情報および投稿は、TradingViewが提供または推奨する金融、投資、トレード、その他のアドバイスや推奨を意図するものではなく、それらを構成するものでもありません。詳細は利用規約をご覧ください。