OPEN-SOURCE SCRIPT
更新済 Parabolic SAR with alerts

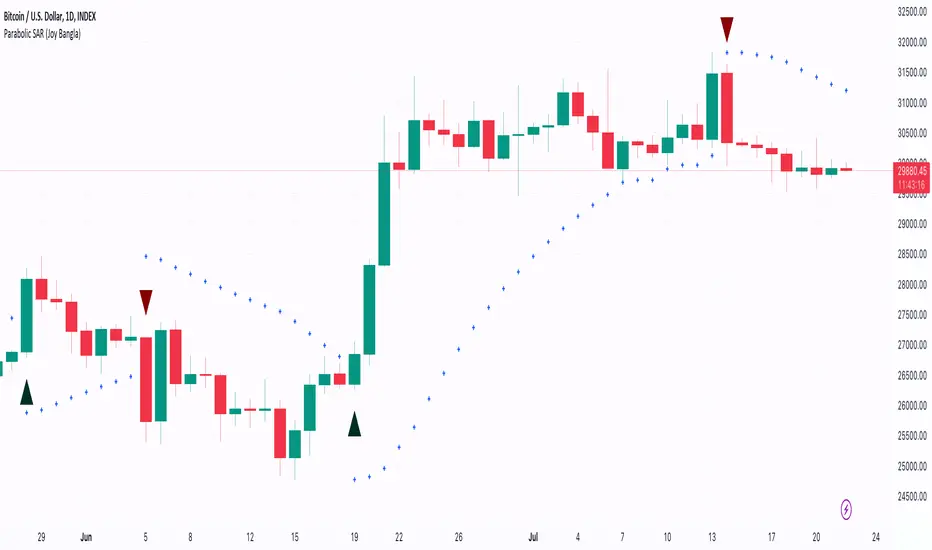
This is Parabolic SAR with alerts built-in.
リリースノート
This script is a custom implementation of the Parabolic SAR (Stop and Reverse) technical indicator, designed to provide potential 'buy' and 'sell' signals.
It first calculates the Parabolic SAR using a start value of 0.02, an increment of 0.02, and a maximum value of 0.2. The resulting Parabolic SAR values are then plotted with blue cross-style markers on the chart.
The script identifies bullish and bearish signals based on the relationship between the Parabolic SAR and the high and low prices:
- Bullish Signal: If the Parabolic SAR is below the current high and above the previous low, a green triangle pointing upward is plotted below the bar. This is seen as a potential 'buy' signal, and an alert titled 'Buy SAR' is set to trigger at this condition.
- Bearish Signal: If the Parabolic SAR is above the current low and below the previous high, a red triangle pointing downward is plotted above the bar. This is seen as a potential 'sell' signal, and an alert titled 'Sell SAR' is set to trigger at this condition.
This custom Parabolic SAR indicator offers a visual and alert-based method for identifying potential trading signals, making it a helpful tool for traders seeking to use it in their trading strategy.
Please note that, like all technical analysis tools, this indicator should be used in conjunction with other forms of analysis and is not meant to provide buy or sell signals.
Always conduct your own analysis and consult a financial advisor before trading.
オープンソーススクリプト
TradingViewの精神に則り、このスクリプトの作者はコードをオープンソースとして公開してくれました。トレーダーが内容を確認・検証できるようにという配慮です。作者に拍手を送りましょう!無料で利用できますが、コードの再公開はハウスルールに従う必要があります。
For guides on how to use the Aladdin indicator or how to buy it, please check joy-bangla.gitbook.io/aladdin/
免責事項
この情報および投稿は、TradingViewが提供または推奨する金融、投資、トレード、その他のアドバイスや推奨を意図するものではなく、それらを構成するものでもありません。詳細は利用規約をご覧ください。