OPEN-SOURCE SCRIPT
更新済 Relative Performance Table
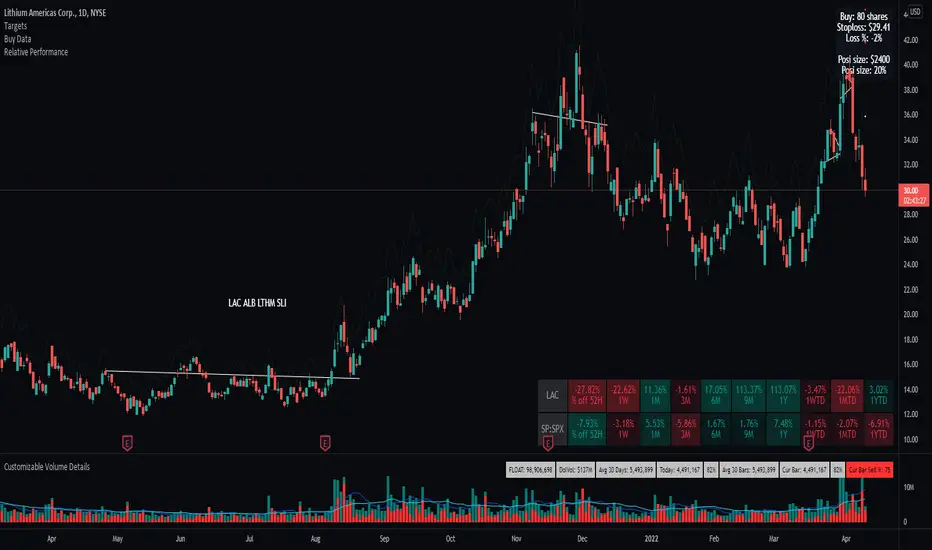
This indicator is based on the Performance section in the TradingView's sidebar and uses new Pine tables functionality, originally coded by @Beeholder. It compares the current price of the symbol to its past price and calculates the rate of return to make it easier to track the performance of the symbol. Note that the Performance sidebar is not updated in real-time, while this indicator is, so on real-time charts the values between the two can differ (the indicator's values are more recent). Made a number of enhancement from Bee's script including relative performance of a selected ticker, dynamic table columns, and other options.
The formula of the calculation is (Current value - Past value) * 100 / Past value, where Past value is:
--Future development will include the ability to transpose the table columns/rows
The formula of the calculation is (Current value - Past value) * 100 / Past value, where Past value is:
- 1W
- 1M
- 3M
- 6M
- 9M
- 52W (1 Year)
- WTD (Week to Date)
- MTD (Month to Date)
- YTD (Year to Date
--Future development will include the ability to transpose the table columns/rows
リリースノート
--Minor fix to tooltipリリースノート
Added 52 week high calculation to quickly screen whether a ticker is within 25% of the 52 week Highsオープンソーススクリプト
TradingViewの精神に則り、このスクリプトの作者はコードをオープンソースとして公開してくれました。トレーダーが内容を確認・検証できるようにという配慮です。作者に拍手を送りましょう!無料で利用できますが、コードの再公開はハウスルールに従う必要があります。
免責事項
この情報および投稿は、TradingViewが提供または推奨する金融、投資、トレード、その他のアドバイスや推奨を意図するものではなく、それらを構成するものでもありません。詳細は利用規約をご覧ください。
オープンソーススクリプト
TradingViewの精神に則り、このスクリプトの作者はコードをオープンソースとして公開してくれました。トレーダーが内容を確認・検証できるようにという配慮です。作者に拍手を送りましょう!無料で利用できますが、コードの再公開はハウスルールに従う必要があります。
免責事項
この情報および投稿は、TradingViewが提供または推奨する金融、投資、トレード、その他のアドバイスや推奨を意図するものではなく、それらを構成するものでもありません。詳細は利用規約をご覧ください。