OPEN-SOURCE SCRIPT
更新済 Logarithmic Bollinger Bands with Secondary Band
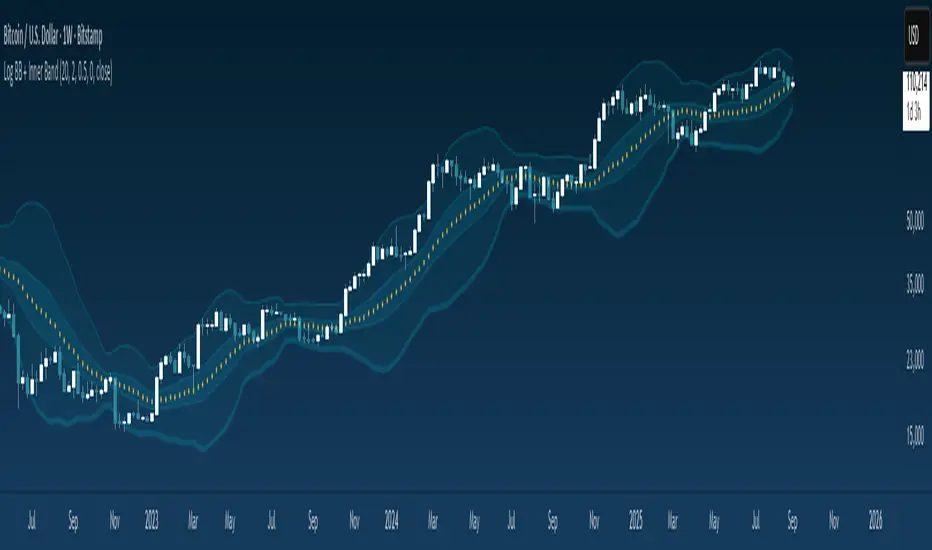
The Logarithmic Bollinger Bands indicator is a variation of standard Bollinger Bands that applies the calculation on a logarithmic scale rather than directly on price values. This approach is particularly useful in markets where assets experience exponential growth or large percentage-based moves, as it allows the bands to adapt proportionally instead of being distorted by absolute price changes. The indicator calculates a moving average of the log-transformed price (the basis), then adds and subtracts multiples of the standard deviation of the log price to form the upper and lower bands. Finally, the results are converted back to normal price scale for plotting. In addition to the primary bands set at 2.0 standard deviations, this version includes a secondary band set at 0.5 standard deviations, offering a closer inner envelope around the mean.
To use this indicator
Traders can observe how price interacts with both the inner and outer bands. The outer 2.0 standard deviation bands represent traditional Bollinger-style boundaries, highlighting potential overbought or oversold conditions when price pushes beyond them.
The inner 0.5 bands provide an earlier signal of price compression and breakout potential, as moves outside these tighter bands often precede larger volatility expansions.
Together, these dual layers give traders a way to monitor both short-term fluctuations and broader trend extremes, making it easier to spot opportunities for entries, exits, or risk management in markets where percentage-based scaling is more meaningful than raw price levels.
リリースノート
Update colors + stylesオープンソーススクリプト
TradingViewの精神に則り、このスクリプトの作者はコードをオープンソースとして公開してくれました。トレーダーが内容を確認・検証できるようにという配慮です。作者に拍手を送りましょう!無料で利用できますが、コードの再公開はハウスルールに従う必要があります。
免責事項
この情報および投稿は、TradingViewが提供または推奨する金融、投資、トレード、その他のアドバイスや推奨を意図するものではなく、それらを構成するものでもありません。詳細は利用規約をご覧ください。
オープンソーススクリプト
TradingViewの精神に則り、このスクリプトの作者はコードをオープンソースとして公開してくれました。トレーダーが内容を確認・検証できるようにという配慮です。作者に拍手を送りましょう!無料で利用できますが、コードの再公開はハウスルールに従う必要があります。
免責事項
この情報および投稿は、TradingViewが提供または推奨する金融、投資、トレード、その他のアドバイスや推奨を意図するものではなく、それらを構成するものでもありません。詳細は利用規約をご覧ください。