OPEN-SOURCE SCRIPT
更新済 RHODL_Ratio
Indicator Overview
This indicator uses a ratio of Realized Value HODL Waves.
In summary, Realized Value HODL waves are different age bands of UTXO’s (coins) weighted by the Realized Value of coins within each band.
The Realized Value is the price of UTXO’s (coins) when they were last moved from one wallet to another.
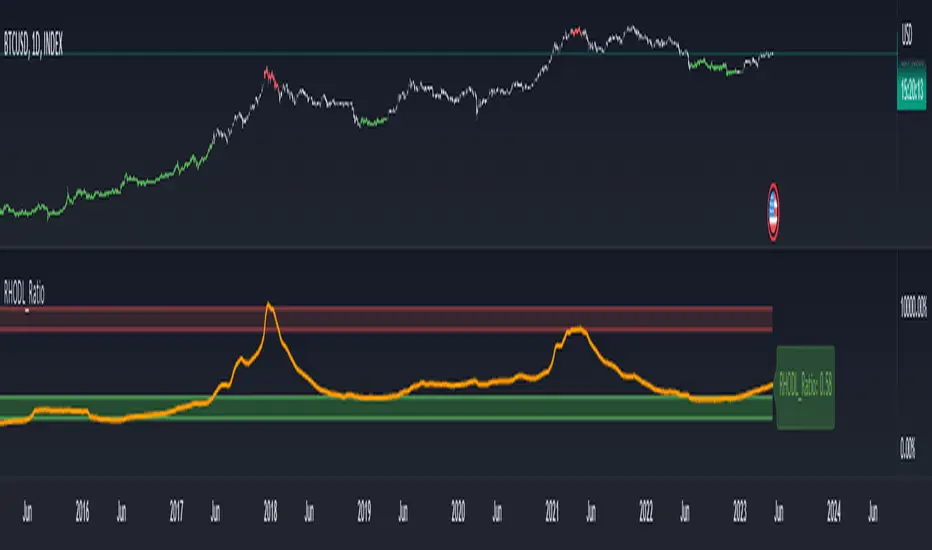
RHODL Ratio looks at the ratio between RHODL band of 1 week versus the RHODL band of 1-2yrs.
It also calibrates for increased hodl’ing over time and for lost coins by multiplying the ratio by the age of the market in number of days.
When the 1-week value is significantly higher than the 1-2yr it is a signal that the market is becoming overheated.
How to Use this Indicator
When RHODL ratio starts to approach the red band it can signal that the market is overheating (Red bars on a chart). This has historically been a good time for investors to take profits in each cycle.
When RHODL ratio starts to approach the green band it can signal great time to buy (Green bars on a chart)
If you change an upper band location this automatically affects on the normalization of value what you can send with allert and what you see on the lable.
This version have differences to original one
Original idea of:
Philip Swift (positivecrypto)
This indicator uses a ratio of Realized Value HODL Waves.
In summary, Realized Value HODL waves are different age bands of UTXO’s (coins) weighted by the Realized Value of coins within each band.
The Realized Value is the price of UTXO’s (coins) when they were last moved from one wallet to another.
RHODL Ratio looks at the ratio between RHODL band of 1 week versus the RHODL band of 1-2yrs.
It also calibrates for increased hodl’ing over time and for lost coins by multiplying the ratio by the age of the market in number of days.
When the 1-week value is significantly higher than the 1-2yr it is a signal that the market is becoming overheated.
How to Use this Indicator
When RHODL ratio starts to approach the red band it can signal that the market is overheating (Red bars on a chart). This has historically been a good time for investors to take profits in each cycle.
When RHODL ratio starts to approach the green band it can signal great time to buy (Green bars on a chart)
If you change an upper band location this automatically affects on the normalization of value what you can send with allert and what you see on the lable.
This version have differences to original one
Original idea of:
Philip Swift (positivecrypto)
リリースノート
-オープンソーススクリプト
TradingViewの精神に則り、このスクリプトの作者はコードをオープンソースとして公開してくれました。トレーダーが内容を確認・検証できるようにという配慮です。作者に拍手を送りましょう!無料で利用できますが、コードの再公開はハウスルールに従う必要があります。
免責事項
この情報および投稿は、TradingViewが提供または推奨する金融、投資、トレード、その他のアドバイスや推奨を意図するものではなく、それらを構成するものでもありません。詳細は利用規約をご覧ください。
オープンソーススクリプト
TradingViewの精神に則り、このスクリプトの作者はコードをオープンソースとして公開してくれました。トレーダーが内容を確認・検証できるようにという配慮です。作者に拍手を送りましょう!無料で利用できますが、コードの再公開はハウスルールに従う必要があります。
免責事項
この情報および投稿は、TradingViewが提供または推奨する金融、投資、トレード、その他のアドバイスや推奨を意図するものではなく、それらを構成するものでもありません。詳細は利用規約をご覧ください。